React Native Debugging Tools

Contents
The most basic debugging tool is the built-in JavaScript debugger.
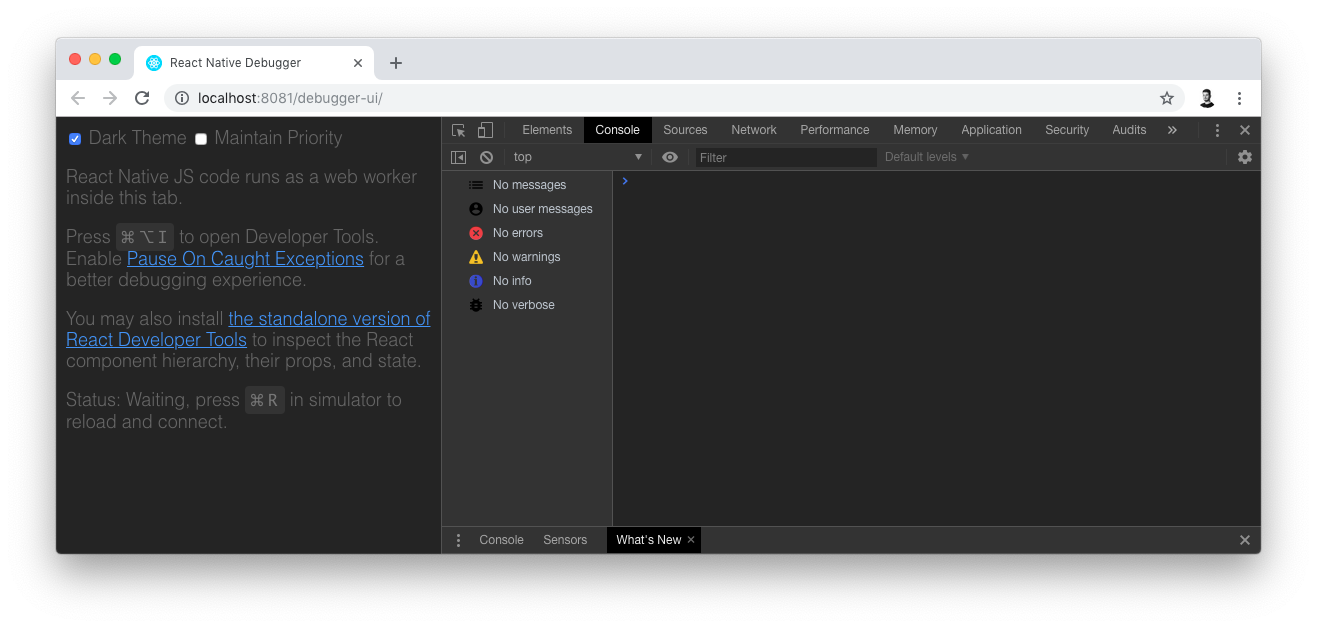
In the simulator menu opened by "command + m" on Android and "command + d" on iOS you can find the "Debug JS remotely" position. The tool opened under "http://localhost:8081/debugger-ui" is the same one, as browser debugger, hidden under the "inspect" menu button. Although It seems complex, Chrome Developer Tools offers only basic features such as logging output to console or using the network tab.
In order to use tools suitable for React, you should use React Developer Tools extension, but the browser version is unfortunately not working with React Native. The only way is using standalone React Developer tools.
The most convenient option is React Native Debugger, which has Chrome Developer Tools combined with React and Redux debuggers. This tool is a desktop app available for Mac OS, Linux, and Windows. Furthermore, it works setup free, unlike React Developer tools.
Chrome dev tools and React dev tools features

Elements - After opening “Toggle Inspector” from the device development menu, you can click on the element, which will be displayed in the “Elements” tab as a React component tree. With a highlighted element, you can not only inspect Its styles but also change or add new ones and results will be immediately displayed in the simulator.
Read more about elements:
https://developers.google.com/web/tools/chrome-devtools/css/
Profiler - detect and diagnose performance issues. You can record nonperformant action and you will get flamegraph with components render duration. Read more about profiler:
https://www.netlify.com/blog/2018/08/29/using-the-react-devtools-profiler-to-diagnose-react-app-performance-issues/
Console - In the console tab, you can inspect errors, warnings, and logs from the app. Read more about the console:
https://developers.google.com/web/tools/chrome-devtools/console/
Sources - Instead of using console.logs, in Sources tab you can open source code and start debugging right away from React Native Debugger. You can set breakpoints and step through the code to find an issue. Read more about debugging JavaScript:
https://developers.google.com/web/tools/chrome-devtools/javascript/
Network - here you can hit the record button and inspect network requests that use XMLHttpRequest or fetch. To enable network inspect you have to click the MacBook touch bar button or the one in the context menu. Read more about the network tab:
https://github.com/jhen0409/services/mobile-development/react-native-development-debugger/blob/master/docs/network-inspect-of-chrome-devtools.md
Memory - hunt memory leaks straight from React Native Debugger, although you can also use Xcode or Android Studio for this purpose. Read more about the memory tab:
https://blog.swmansion.com/hunting-js-memory-leaks-in-react-native-apps-bd73807d0fde
Async storage - in React Native Debugger context menu you can log or clear Async Storage content.
Redux dev tools features
Redux dev tools setup - https://www.npmjs.com/package/redux-devtools-extension
Inspector - showing actions in real time that are firing currently in the React Native app. You can easily jump back in time or skip an action just by clicking the jump/skip button from the menu opened after hovering at the action.

Action tab - displays selected action and data carried to the reducers.

State tab - It shows the entire state tree at the time of the selected action.

Diff tab - It displays what selected action changed in the state tree.

Test tab - It takes your root state and provides a written test on what the end state should hold.

Log Monitor - It displays a list with complete state and actions.
Dispatcher - allows firing a custom action with custom data.

Chart - shows the state in a tree-like structure.

Slider - You can toggle slider and move it through all of the displayed actions. Available also on MacBook touch bar.
Import/Export/Print - Import or export state as JSON from the application. It enables running your app with the custom state.
Reactotron
Reactotron is another tool to debug React Native apps. It can be used interchangeably with React Native Debugger, but both of them have similar features and only one is sufficient. Reactotron is easy to set up and very flexible with Its different extensions. The main Idea, as opposed to previous tools, is mixing redux actions with console responses. It may feel like an advanced version of react-logger.

Connections - on the bottom of Reactotron there is connection panel. You can run multiple devices and quickly switch debugging between them. It is possible to use Reactotron with a different debugger such as React Native Debugger connected.
Timeline tab - timeline of app events and redux actions.
- Log anything from your app to the timeline using eg. Reactotron.log().
- Check redbox errors and quickly find corresponding code.
- Filter events.
- Repeat redux actions.
- Edit and dispatch Redux actions.

State tab
- Subscribe specific store field.
- Create store snapshot with the ability to get back in time to this particular moment.
- Create custom commands to automate dispatching actions.

React Native tab
- A quick switch to the storybook mode.
- Display design on top of an app with "Image overlay" and create pixel perfect UI.


