What Are iOS Memory Leaks and How to Detect Them?

/iOS%20Egypt.jpg?width=6016&height=4016&name=iOS%20Egypt.jpg)
Contents
Leaks and retain cycles are two of the biggest problems for iOS developers when it comes to performance management.
What exactly do these issues look like and, more importantly, how can you detect iOS memory leaks?
iOS memory leaks and retain cycles have the potential to bring huge drawbacks to app optimization, including higher memory consumption, random crashes, and poor overall performance. This is made worse by the fact that memory leaks aren’t always simple issues. They can actually be difficult to track down and solve, especially if you’re working with a large and complex application.
By following our guide, you’ll be able to understand exactly what memory leaks are and how to detect them using Xcode tools.
What is a memory leak?
A memory leak occurs when a piece of memory that was allocated at one point is never released and is no longer referenced by your app, meaning the ARC (Automatic Reference Count) cannot reclaim this memory space.
This often happens because ARC is unable to determine if the memory space is still in use or not, frequently due to retained cycles, which are one of the most common problems generating memory leaks in iOS. To fully understand how a memory leak occurs and its implications, it's crucial to explain how memory management works on iOS through the Automatic Reference Counting (ARC) mechanism.
What is memory management on iOS?
ARC works as memory management on iOS by keeping count of the times when an instance is referred to. These references can either be weak or strong, with the counter increasing by one when an instance of the latter is declared. When this instance is released, the counter decreases by one. Therefore, when the counter is at zero, ARC can deallocate it from the memory heap because it is currently not in use. In contrast to this, weak references don’t increase the counter and are automatically released once it is at zero.
Recognizing potential problems with weak and strong references is relatively easy to fix, but can be hard to spot. This is where retain cycles come in. Understanding the difference between weak and strong references is crucial for managing memory usage effectively, as it directly impacts the monitoring and fixing of memory leaks by altering property references to weak or unowned, thereby reducing memory usage over time.
Retain cycles
Retain cycles occur in ARC when two objects hold strong reference to one another. This means that the first object reference count cannot be zero until the second object is released, but the second object count cannot be released whilst the first object is at zero. This leads to a cycle where each object is needlessly retained because of the inherent count of the other.
Here’s an example of a retain cycle:

Parent and Child have strong references to each other and can therefore never be deallocated from memory.
How can you detect these memory leaks in an iOS app?
As mentioned in the introduction, to find memory leaks in iOS, developers can utilize the Instruments app in Xcode, specifically the Memory Graph tool and Leaks instrument. These tools are essential for developers aiming to identify memory leaks within their applications in real-time. Additionally, the Memory Graph Debugger is a powerful feature for those looking to pinpoint and address memory leaks in an existing project. For more details on how to use these tools effectively, refer to this guide.
Using the Xcode Memory Graph tool
To make memory leak detection easier, Apple introduced the Memory Graph debugger in Xcode 9, allowing developers to stop an app from running and gain a snapshot of the current memory state. From there, a list of all the objects being held in the memory heap can be accessed, and selecting an object reveals all of the objects that are referencing it as well as a backtrace of the object.
To be thorough when detecting memory leaks, you should run the app and navigate through all possible flows by opening the same view controllers several times and entering the memory graph debugger to look at the memory heap. From there, you’ll want to identify objects that shouldn’t be present in the memory heap at that time. For example:
- A view controller that is no longer present in the loop
- An unusual number of instances of the same object
The memory debugger itself should be able to detect potential memory leaks and show a purple exclamation point beside them, but you should always check whether this is a real memory leak or a false positive.
To activate this, you’ll need to enable a few settings within Xcode. It’s also important to note that you’ll need to disable these same settings once you’ve finished debugging, as they will have negative performance impacts if left enabled all the time.
To do this, first edit the scheme for your app in Xcode:

Click on ‘Run’ scheme and then select the diagnostics section. There are two settings in this section that need to be enabled. The first is Malloc Scribble in the memory management group:

Enabling Malloc Scribble will fill freed memory with a predefined value that makes it more obvious when memory is leaked. This increases Xcode’s accuracy of identifying leaks.
The second setting to enable is Malloc Stack in the Logging group. Enabling this will allow Xcode to build an allocation backtrace to help you understand where objects are being referenced from.
Click on the Debug Memory Graph button in Xcode’s variables view at the bottom left:

This loads the application’s memory graph. Next, select the Debug tab in Xcode’s navigator pane on the left to bring up a list of all the objects in memory:
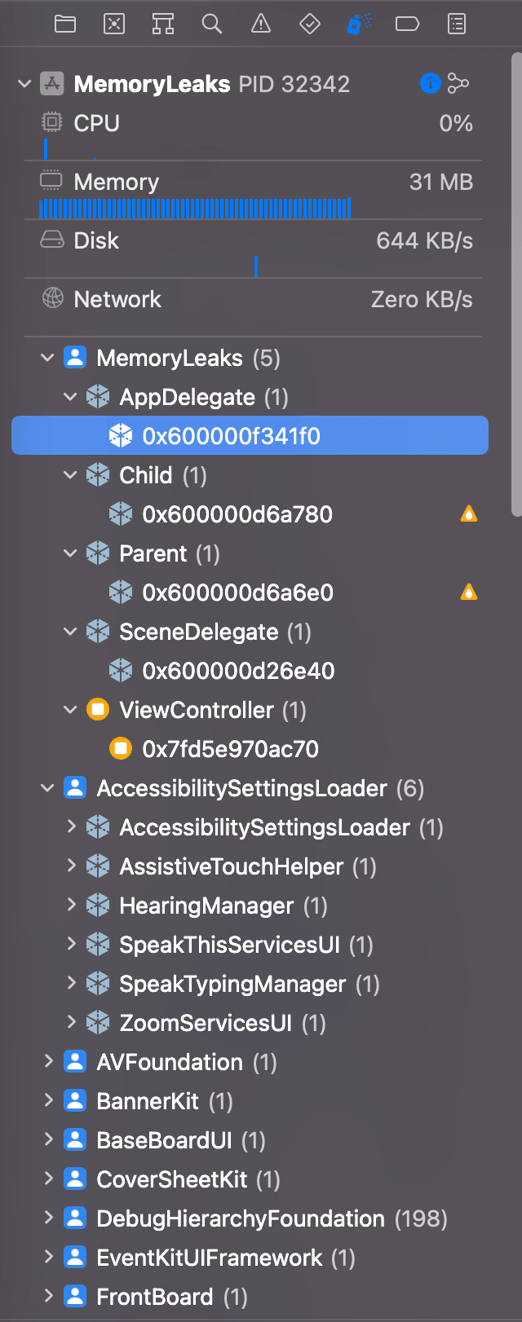
If you click on one of the instances in the debug navigator, it will present you with a relationship graph. This is extremely helpful in understanding which references are still being held, as well as for tracking down where references are created.

Remember: Xcode is not always 100% accurate in identifying memory leaks. Once you’ve finished debugging, don’t forget to turn off the Malloc Scribble and MallocStackLogging settings in the run scheme for your app otherwise they will negatively affect performance.
Using the Instruments tool
The Instruments tool can be used to diagnose memory leaks during application runtimes. After launching the application, you can see a live preview of how many resources are being consumed on the Allocations line and whether or not any memory leaks have been detected on the Leaks line:


 If leaks are detected, you’ll be provided with detailed information including a stack trace and sometimes (unfortunately not always) a memory graph that visually presents how the retain cycle was created. It should be noted that the app can be used to track the runtime on both the simulator and physical device.
Using the Analyze tool
The Analyze tool is a function in Xcode for statically analyzing code after potential memory leaks. Once the analysis has finished running, the developer is provided with a list of suspicious places in the code.


The Memory Graph, Instruments, and Analyze tools are complementary, meaning you can use each of them in conjunction with one another. Because these applications work relatively quickly, you can start debugging right away if you suspect that an application has a memory leak.
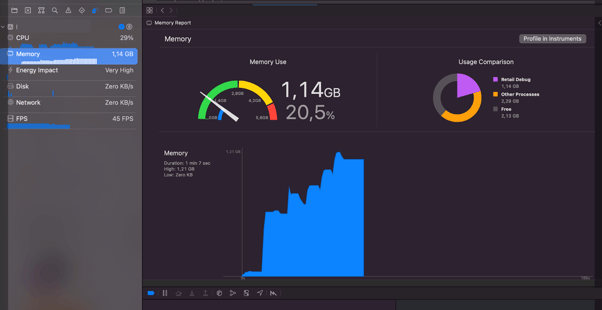
The image above is a classic example of a tell-tale memory leak sign. It shows entering and exiting an ARC view, whereupon exiting the memory should be released and on entering the resources should not be consumed at the same level as before. We can see from the image that the resources arrange themselves in a characteristic pyramid pattern and do not deallocate.
Prevent iOS leaks to improve app performance
Using Xcode and Analyze to locate memory leaks in iOS applications is incredibly useful. Although these tools aren’t always perfect at identifying iOS memory leaks, some skill on the developer’s side can more than make up for these small shortcomings. The consequences of memory leaks can range from a moderate reduction in app performance to a total application failure, meaning it is vital for developers to detect and deal with these issues if and when they arise.
Tech review made by Krzysztof Pacholak – iOS Developer


