React Native Debugger - Stop Using Console Logs - Tutorial


Contents
More and more companies are investing in React Native nowadays.
One of the big players on the stage is Microsoft, who are really engaging in developing React Native. They are the creators of the framework’s Windows version. They also provide very useful developer tools that improve the React Native developer’s experience.
Debugging React Native in VS Code
Let’s be honest, debugging is one of the skills that every developer should have. It’s not possible to deliver bug-free, perfect code on the very first try. Writing code is usually an iterative process with a lot of changes and improvements along the way. Debugging is the skill that can make this iteration faster and less frustrating for developers.
To help with this process, React Native comes with some tools that can be used to debug applications out of the box:
- Flipper - open-source debugging tool developed by Facebook for iOS, Android, and React Native applications. This is integrated by default from version 0.62 which has a plugin library that allows developers to extend its capabilities easily.
- React DevTools - includes a tool that allows you to inspect the React component hierarchies and record performance information.
- Chrome Developer Tools - uses a remote debugging feature and offers only basic features such as logging output to console or using the network tab. They also provide support for classic debugging with breakpoints in the code.
Thanks to Visual Studio Code’s extension called React Native Tools, developers can move from Chrome Developer Tools to a built-in code editor debugger. Being able to set breakpoints and debug a call stack without exiting the editor improves the debugging experience a lot.
In this tutorial, I will guide you on how to install the React Native debugger from scratch. Additionally, I’ll show you how to spot JavaScript errors in React Native apps much more easily.
Setup
Prerequisites:
- VS Code installed
- React Native environment set up: https://reactnative.dev/docs/environment-setup
Tip #1: To check if everything is set up correctly, you can use the following command: “npx @react-native-community/cli doctor”
If you are able to run a React Native app, now it’s time to set up a debugger. To do this:
- Install Microsoft’s React Native Tools extension for VS Code.
- Open launch.json from the .vscode directory. If you don’t have this file, do not worry. Open the VS Code command palette (shortcut by pressing F1) and type “Debug: Open launch.json”. Once you see this command, press on it and a new file will be created and opened.
- Add debug configurations to the newly created file. You can do it automatically by pressing the “Add configurations…” button or do it manually by typing configurations from scratch. In this tutorial we will go with the second option.
You can choose from a variety of debugging options. I recommend setting up four commands:
- Run and debug on iOS Simulator.
- Run and debug on iOS Device.
- Run and debug on Android (Simulator or Device).
- Attach debugger to running packager.
It’s good to know that there are more options here, like debugging Expo, Windows, and Android’s Hermes app.
Let’s add the first configuration for running and debugging code on an iOS Simulator:
   {

      "name": "Run and Debug iOS Simulator",

      "cwd": "${workspaceFolder}",

      "type": "reactnative",

      "request": "launch",

      "platform": "ios",

      "target": "iPhone 11 Pro (13.3)"

    }
All the fields are pretty self-explanatory. You can specify the simulator that you want to run here. If you omit this field, the command will build and run applications on the default simulator.
Tip #2: To get a list of available simulators, run the command: “instruments -s devices”
To test your config, go to the debug tab in VS Code, choose the created config and hit run. The app will build and run. To debug the code, make sure you have debugging enabled in the developer menu.
Running on an iOS device:
When it comes to iOS devices, you need to perform two additional steps:
- Make sure that you have your development provisioning profile set up.
- Install ios-deploy according to the instructions: https://github.com/ios-control/ios-deploy#installation.
Then add the new configuration to launch.json:
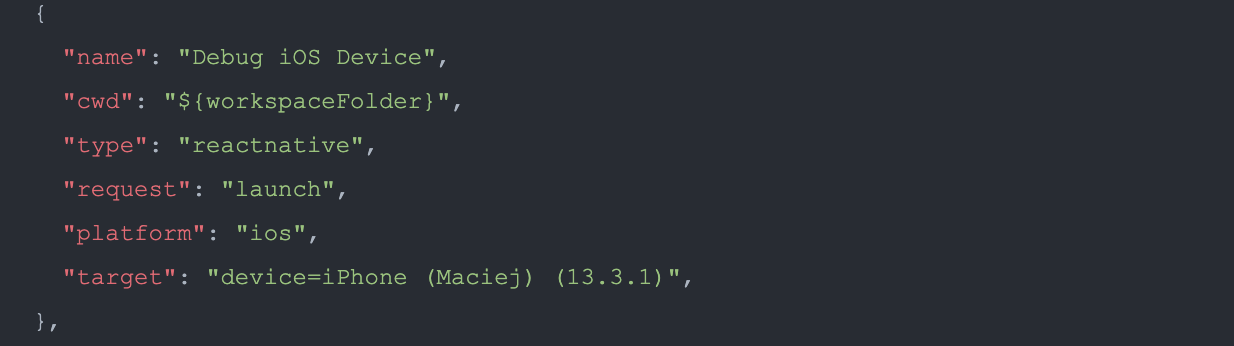
Tip #3: To get the connected devices list, run the command: “xcrun instruments -s devices”
Debugging on Android devices and emulators
When we have the config for debugging on the Apple platform, it’s time to create one for Android. The config for the Android platform is:
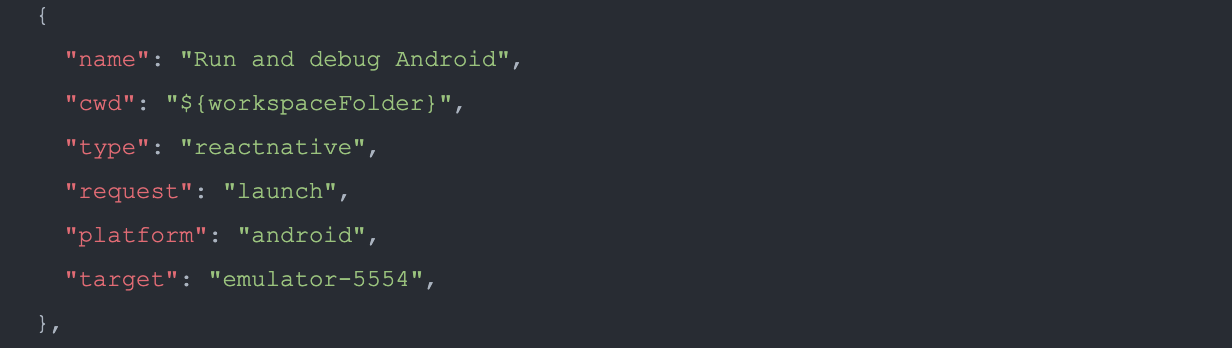
You don’t need to specify the “target” property. If you omit this property, it will run only on the emulator/device connected. Otherwise, the debugger will build and run the app on the emulator/device in the “target” key. If you want to have separate configs for different emulators and devices, specify the device/emulator adb name in the “target” key.
Tip #4: the “adb devices -l” command lists the names of connected emulators and devices
The React Native debugger can’t open an Android emulator, so first you need to start the emulator on your own.
Attaching the debugger to running packager
All the configs above will first build and then run the application on the chosen target platform and device. Building bigger React Native projects can take some time. To avoid building over and over again, you can use the “Attach to running packager” command:
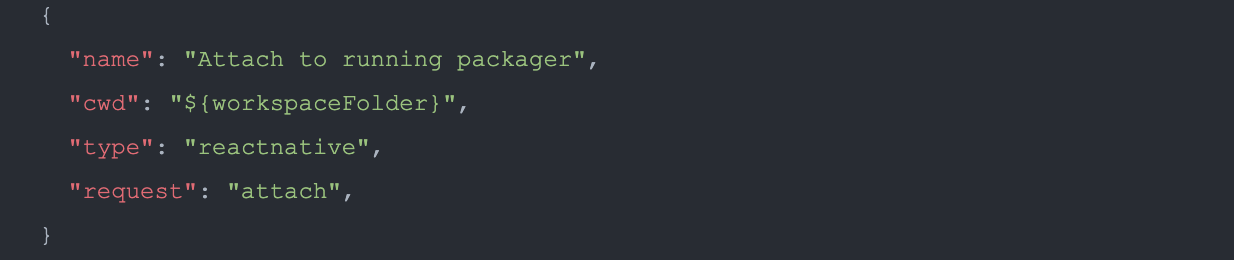
To use this configuration, run your app on the emulator/simulator/device of your choice and start the packager. Then run this debug configuration from the debugging tab. Make sure that you have chosen the “Debug” option from the developer menu.

Debugger GUI description
After setting up the config file, the last step before diving into code debugging is getting familiar with the tool’s main parts, which are:
- Side panel - on the left.
- Toolbar - in the top-right corner.
The side panel contains:
- Variables - all variables divided into closures are listed here
- Watch - dedicated section for watched expressions. Personally, I don’t use it at all because it doesn’t work well with the hooks syntax
- Call Stack - self-explanatory section
- Loaded Scripts - section where all running scripts are listed. I find it handy only for configuration purposes — see the tutorial section “Leveling up existing debugger configurations”
- Breakpoints - from here, we can easily disable/enable/remove/navigate through all previously created breakpoints
The toolbar contains:
- Pause/Continue button - this button will allow you to continue your code execution until it stops on the next breakpoint
- Step over - executes the currently highlighted line and then pauses again
- Step into - similar to step over, but it goes into called function
- Step out - executes all functions at once and goes to the previous function from the call stack
- Stop / Disconnect - stops the debugging process
Debugging, finally!
After setting up the environment, you can finally start debugging. For the purpose of this tutorial, I’ve created a simple app with two buttons and a view that contains randomly generated animal emojis. Users can add or remove animal emojis from the screen by pressing the “+” and “-” buttons.
To see the debuggers in action, let’s create the very first breakpoint in line 36. Code in this line is responsible for adding animals when the user presses the “+” button.
As you can see, if I hit the “+” button, the app stops. The current executed line is highlighted, and on the side panel you have the Variables and Call Stack sections filled out with data. You can also access the data by navigating the cursor on the code editor.
Every debugger shows its potential while navigating through the code.
When you try to navigate using steps commands, you will quickly notice that the debugger will take you into some places where you (probably) don’t want to be, like TouchableOpacity.js, ReactNativeRenderer-dev.js, MessageQueue.js, debuggerWorker.js, events.js, etc. It's very easy to get lost in such code. Most of those file names probably sound familiar to you but we have no reason to debug these files.
With provided configurations, stepping through executed code can be difficult because we will get to the node_modules directory and node.js environment files. But no worries, there is a solution for this problem.
Leveling up existing debugger configurations
To avoid debugging code that is not ours, we can use a configuration property called “skipFiles”. This option takes an array of file or folder names or glob patterns as an argument. All loaded scripts are listed in the side panel. To only debug our code, we need to pass all file names except index.bundle as a skipFiles argument — check final config to avoid doing it by yourself. If you do so, the results are very satisfying. Take a look:
Catching exceptions and conditional breakpoints
There are two more handy tricks that can save you a lot of time. The first one is “catching exceptions”. I highly recommend that you check the “all exceptions” option in the Breakpoints panel. It will stop running code in the exact place where an error has occurred.
Some of you might have spotted the mistake in the provided code example. So let’s run our app and try to find the error:

The app stopped, and we can see in both the error message and Variables panel that the reason for the app stopping is: “animal” is undefined.
If we know the reason, the next step is to find out why the “animal”, instead of being a lion or frog, was undefined. A “conditional breakpoint” is the thing that will help us spot the invalid code. To start using them, right click on the line you want to add the breakpoint to and select the “Add conditional breakpoint...” option. Then, provide your condition (in my case: “randomAnimal === undefined”) and press enter. If the condition is true, the code will stop. Let’s see how it works.
We also shouldn’t get 11 as a result of getting a random index from a 10 element array. So, instead of using “ceil”, we should use the “floor” to round our number.
That's all when it comes to the basics of using debuggers. I hope that you found my tutorial useful and that you will consider dropping console.logs for this great debugging tool I described today.
The full example with the config repository can be found here.
Bonus - Some issues that I’ve found during my day-to-day work:
ISSUE #1
Description: I couldn’t run one project using the “Run and Debug iOS device” command. The command kept failing.
Solution: Build and run the app using Xcode and then use the “Attach to the running Packager” command.
ISSUE #2
Description: Breakpoints don’t go to the exact line of code when the code has been changed.
Solution: Reload the app on the phone/simulator. VS Code debugger uses bundled JavaScript code, so if you change it you need to reload the bundle in order to debug with no issues.


