Embedded Analytics with Business Intelligence


Offering high-quality analytics designed with UX/UI in mind and with efficiency at its core, embedded analytics have the potential to transform businesses.
Over the past few years, companies have made an effort to move from manual excel reporting to automated data analysis such as using BI dashboards and databases. As a result of integration analytics deeper, business processes have become more efficient and people have improved access to verified data and data analysis.
But it’s not only about internal company reporting. Recently more and more companies have chosen to enhance their products with self-serve analytics components and integrate analytics solutions. for example, by using embedded analytics.
This is a big step, and not without challenges dashboards of popular companies such as Tableau, Power BI, or Qlik are published in a separate place, meaning users have to independently access relevant data and analytics, which is often not very intuitive. In addition, many companies struggle with having too many dashboards, which makes it difficult for users to find what they need.
Embedded analytics is an approach that provides integrated analytics exactly where and when it is needed, within existing platforms. For this purpose, embedded analytics tools such as Tableau, Sisense or Quick-sight are good examples.
What is embedded analytics?
The essence of embedded analytics is to place analytical capabilities within the larger platform that business users are already using for other purposes. This significantly improves the ease of access to analytics, key insights, data points and, crucially, a higher level of user engagement.
What does the embedding look like?
Embedded analytics with BI tools is a combination of business intelligence and web-development, allowing for data insights that support management level decisions.
Embedding analytics means that business intelligence specialists build charts, dashboards and more dedicated tools and then developers use HTML code, iframe, JavaScript API or REST API to place it as a part of an existing analytics platform, like webpage, desktop or mobile applications. Depending on the tools that will be used, opportunities and limitations might be slightly different.
What is important when it comes to embedded analytics solutions?
Embedded analytics follows the latest trends to provide insights and data visualizations where and when it’s needed. With the reality of an ever-growing number of dashboards, it’s important to provide users with analytics tools that present relevant data at any given time, omitting the unnecessary step of switching to another platform to access analytics.
In contrast to custom front-end development, the embedded analytics BI tools approach makes for an effective process of delivering analytics.
BI developers can use their analytical capabilities and tools to provide a high quality embedded analytics solution in a relatively short time, increasing efficiency for business users.
It is no longer required for front-end developers to build complex charts, they can focus on a centralized overview and create a seamless user experience. Also, any adjustments required in the future can be addressed with BI tools, which accelerates adjusting analytics to current business needs to offer actionable insights.
Thanks to the combined analytics capabilities of business intelligence tools with the power of custom front-end development, companies that decide to use embedded analytics have almost unlimited possibilities in design and functionality for use across multiple applications.
Developers will be able to exactly follow UX/UI mock-ups and guidelines with the user’s natural workflow in mind, to create custom downloading and filtering buttons, as well as write-back to the database, which is not an option with most of BI tools.
What are the key elements of embedded analytics?
With the growing amount of data and the need to get the analytics quickly to offer solutions to high value business problems, analytical solutions are becoming more sophisticated and intuitive.
There are many forms in which data can be delivered to end users, considering opportunities like data visualization to data storytelling to share business intelligence. Thanks to the latest BI tools, most of them can be also embedded as an integral part of analytics platforms.
Dashboards and charts
Interactive charts and dashboards are the most popular form of delivering analytics today. By using them, analysts can select the best data visualization that will provide end users with the best data consumption.
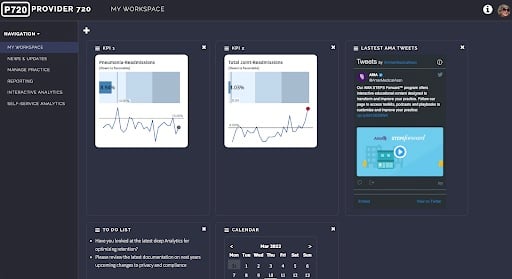
Source: embedded.tableau.com
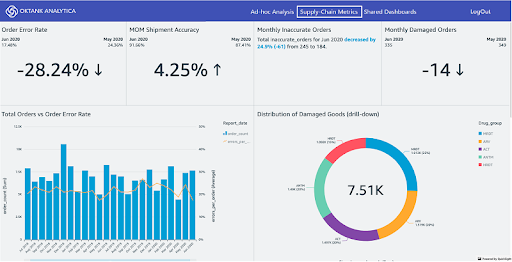
Dashboards are a collection of individual charts that together form a logical whole, ensuring comprehensive analytics of a given topic. By taking advantage of interactivity, users are able to use filters to slice and dice the data that they want to see or parameters to change calculations, simulations and charts.

Source: embedded.tableau.com
Self-service analytics
A relatively new way of delivering data to users is through self-service analytics. This can be achieved by combining ready-made data sources and a simple interface (provided by the BI tool) that enables users to easily generate the charts they require, incorporating relevant data
It is also possible to use Natural Language Processing (NLP), where users would simply write what they would like to see and the algorithms can prepare ready-made charts and numbers - one of the more effective tools is AskData from Tableau.
Static reports generation
Despite the possibility of using modern and interactive dashboards, there is often a need to generate static reports such as tables or PDF files. With the use of embedded analytics, it is possible to prepare end users to select metrics and dimensions, preview and generate such files and then download them in any format.
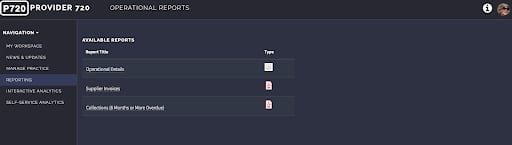
Source: embedded.tableau.com
Embedded analytics tools
The market for embedded analytics solutions is significant and constantly growing. The largest players include Tableau, PowerBI, Sisense Looker, Qlik, but taking into account the maintenance and license models, there are also other modern analytics solutions that are worth paying attention to. Interesting alternatives include AWS QuickSight and the open-source Apache Superset which we describe below in comparison to an example leader, Tableau.
Tableau
Tableau has been recognised as one of the leaders among traditional business intelligence tools for embedded analytics. It provides best in class visualization and dashboarding options along with a super friendly and intuitive interface. In many places it exceeds traditional BI capabilities by offering AI and ML functionalities and AskData.
Tableau offers two license models - one is based on number of viewer licenses and costs 144 USD/year per use The alternative is core based, where 8 core servers costs 72k USD and is able to handle about 300 concurrent user sessions. Additionally there is a cost of 840 USD per year for each creator license, which is essential for developing the dashboards. On top of this there is the cost of infrastructure that can be hosted on premise or in the public cloud.
This BI tool allows you to connect to multiple data source types including flat files, SQL databases, Snowflake and even web data. Depending on the connection type latest data can be triggered automatically at desired frequency, even every second. Servers and data can be stored on premise, which means that in case of location constraints it can be stored in any location.
Tableau is known for its advanced BI and reporting capabilities - it’s possible to create multiple types of interactive charts, allows users to download data as PNG, CSV, PDF, Excel and PowerPoint. It also offers a possibility to set-up alert notifications through email and slack. It’s also possible to subscribe particular charts to get them directly to the mailbox.
It also provides a flexible way of managing permissions by adding users or groups to particular projects or views, it’s also possible to create row-level permissions. It’s possible to manage user authentication and SSO with Trusted Authentication, Kerberos, Active Directory, SAML and OpenID. Users, groups and permissions can be also managed by API.

Source: embedded.tableau.com
QuickSight
QuickSight is a business intelligence and embedded analytics platform provided and supported by AWS. It is not typically mentioned among the leaders of this type of tool, but also has its advantages, which in many situations can determine its position as tool of choice.
The license model of QuickSight is based on number of sessions (30 mins interaction with the dashboard) and costs 3k/20k/57.6k/94k USD per 6k/50k/200k/400k sessions and it can be used by an unlimited number of users. Additionally 216 USD will be charged for each “author” license. There are no additional costs of infrastructure and it scales-up automatically. There is also no need for additional support or maintenance of the servers.
QuickSight can be connected to multiple data sources including SQL databases, flat files, data warehouses like Snowflake, however the list of possible connections is shorter than in Tableau. From geolocations constraints perspective, this can be stored in locations available in AWS (e.g. in EU London, Stockholm), but it’s not possible to keep this on premise. Live analytics connection is also possible.
QuickSight is not recognised as a leader in Business Intelligence tools, but offers a good number of possible charts. Some of them (e.g. Sankey charts) are much easier to create than in Tableau. Unfortunately there are fewer options for customisation - only several fonts are available, and no advanced background formatting. Data for the dashboard can be downloaded as CSV, Excel or PDF.
User authentication can be done with SSO using AWS service or with third party services like Okta, Ping or Microsoft Active Directory. Users and groups management can be done using both API and application interface. In enterprise version permissions can be also configured on both row and column level which makes it possible to grant users access only to the subset of data.
Source: Embed multi-tenant analytics in applications with Amazon QuickSight
Apache Superset
Compared to the two previous tools, Apache Superset is open source and free. There is no central support, but it offers great opportunities for embedding analytics when paying only for infrastructure. It should be noted at the very beginning that it will require a lot of general DevOps skills to set up an environment and connect to data sources.
The only cost that comes with Apache Superset is the cost of infrastructure and as a result the number of both viewers and developers is unlimited. Superset can be deployed on premise or on the public cloud, however in contrast to other tools, an administrator needs to put an effort to maintain and scale the resources to provide seamless functioning of the dashboards.
Superset can be connected to multiple types of data sources like SQL databases, data warehouses, object storage services, or google sheets. Unfortunately supersets are not as intuitive to use and will require at least basic programming skills. As this is open source and self-deployed service it can be stored in any location.
Superset offers a good number of possible visualizations, but not as good as Tableau or QuickSight, moreover it’s also not very easy to build a dashboard. The way of building the dashboards is different than in most of the popular business intelligence tools, but for those with some experience it shouldn't pose too much of a challenge. It’s also possible to download the data in CSV, PNG or XLSX format.
Security in Superset is managed by Flask AppBuilder, which provides user management and authentication. This tool can be integrated with SSO providers like Okta or Active Directory or configured with custom Oauth2. Even if it’s not very intuitive, it gives a lot of possibilities like row level security and other custom permissions.
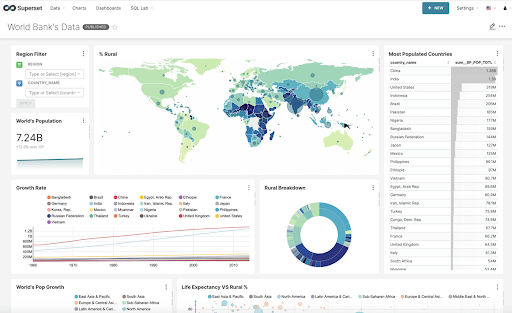
Source:https://superset.apache.org/
Embedded analytics embraces the power of BI for the future
An embedded analytics solution is a way to remain innovative in being data-driven. These kinds of tools significantly improve access to data and analytics in business applications, and the use of BI allows for the effective creation and management of charts and dashboards. The choice of embedded analytics tools is vast, but as they are also associated with a range of costs, researching the right option for your business is key.
Before starting development, ensure that you’re clear on your requirements to choose the tools and embedded analytics partner that best address your needs at the lowest cost.
The increasing adoption of data analytics, guaranteeing data availability, and implementing cloud BI are one of the major factors driving the market. This demonstrates the impact high-quality solutions like embedded analytics will have on your business now and in the future.


