Introduction
Contents
Data science – in a nutshell – is the study of large volumes of data using modern tools. It’s an interdisciplinary field that provides a holistic, thorough, and refined look into raw data.
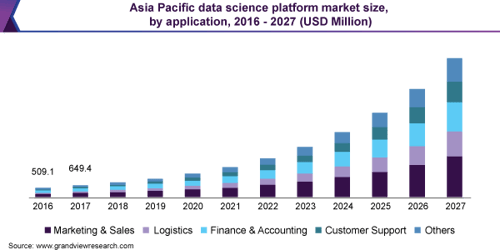
The profession continues to evolve and is an in-demand career path. According to a report by Grand View Research, Inc, the market for data science and analytics is still on the rise, expected to reach $25.94 billion by 2027.
In this article, we dig into the intricacies of data science and give you an overview. Alongside definitions and history, we talk about techniques and tools, the life cycle, and real-world uses you may find surprising. Read on for our detailed guide.
Data science definition
Data science is an umbrella term for the various techniques and methods data scientists use to transform data into actionable insights. These insights can have a massive impact on the bottom line of organizations. To extract valuable information from data and solve complex analytical problems, data science approaches combine a number of fields. These disciplines include data analysis and algorithmic development.

How does discovering hidden patterns from raw data differ from what statisticians have been doing for years? The answer lies in the difference between explaining and predicting.
Data analysis explains what’s going on by processing the history of data. It uses descriptive analysis and prediction to a certain extent. Data science not only does exploratory analysis, but it also looks at the data from other angles. As a result, data science helps make decisions and predictions. For example, data science uses advanced techniques and algorithms to identify the occurrence of a particular event in the future.
The primary objective of data science? Generating information that brings tangible value to your enterprise. It allows you to discover unknown unknowns for your business, and supports corporate reporting.
A quick note on machine learning (ML) before we move on, because it’s often talked about as part of data science. Here at Netguru, we separate it from data science.
Why is data science important?
Traditionally, data was mainly structured and it was possible to analyze it using simple business intelligence tools. Today, most data falls in the unstructured or semi-structured category. Gartner reports that unstructured data makes up 80% of a company’s data.
Unstructured data is data that’s generated from sources such as text files, video, and email. Structured data is easy to analyze; unstructured data requires more work to process and understand. Simple tools can’t process unstructured data, which is why there’s a need for more complex and advanced analytical tools. That’s one of the reasons data science is so popular and important.
There are other reasons data science is important and adds value to a business.
Data science:
- Empowers management to make better decisions
- Directs actions based on trends and helps define business goals
- Challenges staff to adopt best practices and focus on issues that matter
- Identifies opportunities
- Make decisions using quantifiable, data-driven evidence
- Identifies and refines target audiences
- Enables testing of decisions
- Helps recruit the right talent
Foundations of data science
Data science is an interdisciplinary field focusing on extracting knowledge from data sets. These data sets are generally large, and referred to as big data.
Data science is about applying knowledge and actionable insights from data to solve problems.
Areas encompassed in the field include:
-
Preparing data for analysis
-
Formulating data science problems
-
Analyzing data
-
Developing data-driven solutions
-
Presenting findings to inform high-level decisions
As a result, data science incorporates skills from computer science, statistics, information science, and math. Not only that, it uses information visualization, data integration, graphic design, complex systems, communication, and business.
Data science is also linked to human-computer interaction (HCI). HCI studies the design and use of computer technology. It focuses on the way people interact with computers.
Relationship to statistics
It’s argued by many statisticians such as Nate Silver that data science is not a new field. Instead, it’s another name for statistics. Others argue data science is distinct from statistics. Why? It focuses on problems and techniques unique to digital data.
It’s put forward by professor Vasant Dahr that statistics emphasizes quantitative data and description. Data science on the other hand deals with quantitative and qualitative data like images. It emphasizes prediction and action. Others think data science is an applied branch of statistics.
Etymology and history of data science
In decades gone by, data science as a discipline has been on the horizon. Let’s look at some evidence.

Early usage
Rewind to 1962: John Turkey described a field he called “data analysis” that resembles modern data science. The term data science itself goes back to 1974, when Peter Naur proposed it as an alternative name for computer science.
In Beijing in 1985, lecturer C.F. Jeff Wu used the term data science as an alternative name for statistics.
At a 1992 statistics symposium in Montpellier, a new discipline focused on data of various origins and forms emerged and received acknowledgment. The discipline combined established concepts and principles of statistics and data analysis with computing.
Come 1996, the International Federation of Classification Societies featured data science as a topic. However, the definition of data science was still in flux.
A year later in 1997, C.F. Jeff Wu once again suggested the renaming of statistics to data science. His reasoning? A new name would help statistics shed inaccurate stereotypes, such as being synonymous with accounting or limited to describing data.
Fast forward another year to 1998 and Japanese scientist and mathematician Hayashi Chikio argued for data science as a new, interdisciplinary concept. He put forward three aspects: data design, collection, and analysis.
Current usage
Data science as an independent discipline in the 21st century? It’s attributed to professor William S. Cleveland. In a 2001 paper, he put forward an expansion of statistics beyond theory into technical areas. That meant a significant change to the field and warranted a new name.
Since then, data science as a term has been more widely used.
For example, in 2002, the Committee on Data for Science and Technology launched the Data Science Journal. A year later, Columbia University started The Journal of Data Science.
In 2014, the American Statistical Association's section on statistical learning and data mining changed its name to statistical learning and data science. That highlighted the popularity of data science.
However, the definition of data science is still debated, with variations depending on who you talk to and what publication you read.
Data scientist term history
Now we’ve talked about the history of data science, let’s briefly take a look at the coining of the term data scientist.
Apparently, it happened in 2008, when businesses began to realize the need for data professionals skilled at organizing and analyzing massive amounts of data.
Hal Varian, Google’s Chief Economist and UC Berkeley Professor, predicted the importance of adapting to technology’s influence in a 2009 McKinsey & Company article:
“The ability to take data – to be able to understand it, to process it, to extract value from it, to visualize it, to communicate it – that’s going to be a hugely important skill in the next decades.”
Impact
As the world entered the era of big data around 2005, the need for data storage grew. That was a major challenge for industries until 2010. When Apache Hadoop and other frameworks solved the problem of data storage, focus shifted to the processing of that data.
Forrester estimated that by 2020, data-driven businesses would be collectively worth $1.2 trillion, up from $333 billion in 2015.
How are data scientists explained as a profession? They break down big data into usable info. They also create software and algorithms that help companies and organizations determine optimal operations. These are invaluable insights and opportunities for businesses.
The pillars of data science expertise

There are four main pillars of essential knowledge for a successful data scientist. These are:
1. Written and verbal communication
A data scientist needs to be able to tell the story of data to their clients. Being able to explain data transition stages is an important part of analytics.
Once you’ve drawn conclusions from analyzing data, you need to be able to communicate your findings to others. That may be in the form of a report or in-person as a presentation. Regardless, data science projects involve some form of communication of your findings.
2. Math skills
Mathematics is important in the data science world. For example, if you’re applying a complex algorithm to build a model, you must understand the math behind that complicated algorithm. Prerequisites to joining the field include linear algebra, multivariable calculus, and optimization techniques. Other must-haves are statistics and probability.
3. Computer Science
This plays a major role in data science. Whether you draw a complex chart or implement complex algorithms, it’s not possible without a programming language like Python or R. To handle the big data, you must have knowledge of programs like Relational Database, SQL, and MongoDB.
4. Domain Knowledge
The main objective of data science extracting useful insights from data is to profit or help a business. To understand a problem, you need to know how the business model works. You also need to ask the right questions to obtain the information you need. Visualization tools like Tableau help you display your valuable results in non-technical formats like graphs or pie charts.
Data science goals and deliverables
To understand the importance of the pillars of data science, you also need to understand the goals and deliverables associated with data science projects. It’s also important to be aware of the data science process itself. More on the process in the next section. Now, let’s delve into common data science deliverables. These include:
- Prediction. For example, predict a value based on inputs.
- Classification. Examples include classifying an email as spam or not spam.
- Recommendations. These include the ability of companies like Amazon and Netflix to make recommendations to customers.
- Pattern detection and grouping. For example, classification without known classes.
- Anomaly detection. An example is fraud detection.
- Recognition. For example, image, text, audio, video, and facial recognition.
- Actionable insights. View these via dashboards, reports, and visualizations.
- Automated processes and decision-making. An example is credit card approval.
- Scoring and ranking. For example, getting your FICO credit score.
- Segmentation. Includes things like demographic-based marketing.
- Optimization. An example is risk management.
- Forecasts. For example, sales and revenue.
Each of these deliverables addresses a goal and/or solves a problem. For instance, let’s say the goal of a data scientist is to create a high-performing prediction engine. The business the data scientist is working for has another goal in mind. Their goal is to use the prediction engine to increase revenue.
That example illustrates why domain knowledge is so vital.
Upper management is likely to possess business-centric educational backgrounds. While they may be smart individuals, they may not be well-versed in data science tools, techniques, and algorithms.
Given that, they may not be in a position to tell a data scientist what they’d like as a final deliverable. They may also lack the knowledge to suggest the data sources, features, and path to get to the deliverable.
Even if they determine a specific recommendation engine could increase revenue, they may not realize there are many other ways the company’s data can increase revenue as well.
First-rate data scientists must have a comprehensive understanding of how businesses work in general, and how to use a company’s data to achieve top-level business goals. They must ask the right questions to understand what stakeholders are looking to achieve. With their knowledge, they may also be able to inform stakeholders about other benefits that may be achievable.
By having domain expertise, data scientists are able to discover and propose new data initiatives to help a business achieve its goals and maximize KPIs.
Data science life cycle
A common error that’s made with data science projects is rushing into data collection and analysis. Often, that’s done without understanding the requirements or framing the business problem. It’s important to follow the phases of the data science life cycle, to ensure your project runs smoothly.
There are six main phases to the data science lifecycle. Also known as the data science process, each stage requires different techniques, programs, and skillsets.
1. Discovery
Before starting a project, you need to understand the specifications, requirements, priorities, and required budget. It’s important to ask the right questions regarding these factors.
At this stage, you assess whether you have the necessary resources to support the project. For example, resources include people, technology, time, and data. During discovery, you also need to frame the business problem and formulate initial hypotheses (IH) to test.
2. Data preparation
Here, you need an analytical sandbox to perform analytics for the duration of the project. At this pre-modeling stage, you explore, preprocess, and condition the data.
Additionally, you need to extract, transform, load, and transform (ETLT) to get the data into the sandbox. After ETLT there’s data conditioning, then surveying and visualizing. You can use R to carry these out. That helps spot outliers and establish a relationship between the variables. Once the data is clean and prepared, the next step is exploratory analytics.
3. Model planning
Exploratory analytics involves model planning. At this stage, you decide what methods and techniques to use to draw relationships between the variables. These relationships form the basis of the algorithms you implement at stage four.
Back in this phase, you apply exploratory data analytics (EDA) using visualization tools and statistical formulas. There are various model planning tools at your disposal. Common tools include Python, SQL, R, and SAS/ACCESS – more on these later. Using your tool of choice, you gain insights into the nature of your data and decide on the algorithms to use.
4. Model building
At this phase, you develop datasets for training and testing. It’s important to consider whether your existing tools are sufficient to run the models. If they aren’t, you need a more robust environment like fast and parallel processing.
To build the model, you also need to analyze learning techniques like classification, association, and clustering. Common tools for model building? These include Python, R, SAS Enterprise Miner, WEKA, SPCS Modeler, Matlab, Alpine Miner, and Statistica.
5. Operationalize
During the operationalize phase, you deliver final reports, briefings, code, and technical documents.
As well as these, you may decide to implement a pilot project in a real-time production environment. Why? It provides you with a small-scale but clear picture of performance and other related constraints before full deployment.
6. Communicate results
At this final stage, evaluate whether you’ve achieved the goals planned in phase one. You identify all the key findings, communicate them to your stakeholders, and determine if the results are a success or a failure based on the criteria developed in stage one.
Techniques
In the last section, we touched on some tools and techniques used to achieve data science tasks. Now, let’s dig into these in more detail.

There are many tools and techniques used in data science. Let’s start by defining each. Techniques are the procedures followed to perform a task. A tool is the equipment used to apply a technique to perform a task.
Techniques
Data science uses many mathematical and statistical techniques. They’re used for data collection, modification, storage, analysis, insights, and representation. Data scientists use the following techniques:
- Ensemble learning. This uses multiple models such as classifiers or experts that are strategically generated and combined to solve a computational intelligence problem. Examples include bagging techniques such as random forest and boosting techniques like gradient boosting.
- Probability and statistics. These form the basis of data science. Probability theory is helpful for making predictions. With the help of statistical methods, it’s possible to make estimates for further analysis. Statistical methods are largely dependent on the theory of probability.
- Distribution. Usually probability distribution in the field of data science, it’s a mathematical function that provides the possible value of a variable and how often it occurs.
- Descriptive statistics. A type of statistics used to summarize and describe a dataset. It’s generally used in data science to determine if the sample is normally distributed. The results? Displayed in tables, charts, and frequency distributions.
- Inferential statistics. This type of statistics allows you to make predictions based on a sample of data.
- Nonparametric statistics. This refers to a statistical method where data is not assumed to come from prescribed models determined by a small number of parameters. Examples of prescribed models include the normal distribution model and the linear regression model. Nonparametric statistics sometimes use ordinal data. That means it doesn’t rely on numbers, but rather a ranking or order.
- Hypothesis testing. A type of statistics where a data scientist tests an assumption regarding a population parameter. The methodology depends on the nature of the data used and the reason for the analysis.
- Neural Networks. This is a series of algorithms trying to recognize underlying relationships in a set of data. That’s achieved via a process that mimics the way the human brain operates. Neural networks adapt to changing input. That means the network generates the best possible result without needing to redesign the output criteria.
- Regression analysis. A statistical method that attempts to determine the strength and character of the relationship between one dependent variable and a series of independent variables.
- Linear regression. Part of statistics, this is a linear approach to modeling the relationship between a scalar response and one or more explanatory variables. When you have one explanatory variable, that’s called simple linear regression. If you have more than one explanatory variable, you have multiple linear regression.
- Logistic regression. Part of statistics too, here you have a logistic model to represent the probability of a certain class or event existing. For example, classes or events include pass/fail, win/lose, alive/dead, healthy/sick. It’s possible to extend these to model several classes of events. Examples include determining whether an image contains a cat, dog, or lion.
- Decision tree. Here you have a decision support tool that uses a tree-like model of decisions and their possible consequences. These include resource costs, chance event outcomes, and utility. A decision tree is a way of displaying an algorithm that only contains conditional control statements.
- Support vector machine (SVM). Defined as supervised learning models with associated learning algorithms, SVMs analyze data for classification and regression analysis.
- Clustering. Cluster analysis is grouping a set of objects so that objects in the same group – called a cluster – are more similar to each other than those in other groups or clusters. Clustering forms the main task of exploratory data analysis, and is a common technique for statistical data analysis.
- Dimensionality reduction. Also called dimension reduction, this is the transformation of data from a high-dimensional space into a low-dimensional space. The low-dimensional representation retains some meaningful properties of the original data. Why do that? Working in high-dimensional spaces is undesirable. That’s because the raw data is often sparse because of the curse of dimensionality. What’s more, analyzing the data is usually computationally intractable.
- Predictive causal analytics. For a model to predict the possibilities of a particular event in the future, you need to apply predictive causal analytics. For example, if your business offers money on credit, the probability of customers making credit payments on time may be a concern. In a case like that, build a model to perform predictive analytics on the payment history of the customer. That model predicts whether future payments will be on time or not.
- Prescriptive analytics. Do you need a model that has the intelligence of taking its own decisions and the ability to modify with dynamic parameters? Then you need prescriptive analytics. This data science field is all about providing advice. It not only predicts, but also suggests a range of prescribed actions and associated outcomes. An example is Google’s self-driving car. The data gathered by vehicles helps train self-driving cars. Running algorithms on the data brings intelligence to it. That enables the car to make decisions like when to turn, which route to take, and when to slow down or speed up.
Tools
There are also many tools used in data science to work on data at different points in the life cycle. We’ve categorized these according to these processes:
- Data collection tools. Examples of these include Amplitude, Matomo, and Trackur. For instance, use Amplitude for behavioral analytics data for web and mobile apps.
- Data storage tools. These store huge amounts of data and interact with it. Data storage tools provide a platform to unite servers, enabling easy access to data. Examples of these include Snowflake, AWS Redshift, and Google BigQuery. For instance, Snowflake offers a single, integrated platform delivered as-a-service, where data workloads scale independently from one another.
- Data Extraction tools. Also known as web scraping tools, these automated tools extract info and data automatically from websites. Data extraction tools include OctoParse and Content Grabber. OctoParse is available in both free and paid versions and gives data as output in readable structured spreadsheets.
- Data cleaning or refining tools. These tools integrate with databases and are time-saving. How? They search, sort, and filter data used by data scientists. Examples include Apache Spark, Apache Storm, Flink, Hive, Data Cleaner, OpenRefine, MapReduce, Rapidminer, and Talend. Data Cleaner works with Apache Hadoop and is a powerful data indexing tool that improves the quality of data by removing duplicates, transforming them into one record.
- Data analysis tools. These analyze data and also perform operations on the data. For example, they inspect data and study data modeling to draw useful information. That info is conclusive and helps make decisions regarding a certain problem or query. Examples include R, Apache Spark, Python, Apache Storm, SAS, Flink, and Hive.
- Data visualization tools. These present data in a graphical representation for clear insight. Many are a combination of previous functions we've talked about, and can also support data extraction and analysis along with visualization. Examples include Python, Tableau, Orange, Metabase, Looker, Apache Superset, and Google Data Studio. Additionally, DataWrapper, Qlik, and Gephi are open-source and support CSV files as data input. At Netguru, we use Google Data Studio, a tool that turns data into informative, shareable, and fully customizable dashboards and reports
As promised, here’s a bit more info on the model planning tools we mentioned above:
- R. This is a commonly used tool. It offers a complete set of modeling capabilities and provides a sound environment for building interpretive models. It supports various platforms, including Windows, Mac operating system, and Linux.
- SQL. Also known as structured query language, this domain-specific tool performs in-database analytics using data mining functions and basic predictive models.
- SAS/ACCESS. This software accesses data from Apache Hadoop, and creates repeatable and reusable model flow diagrams.
The rise of Python
We mentioned knowledge of programming languages like Python or R being essential. For many years, R was the obvious choice for data scientists. In recent times, that’s changed. Python is challenging R’s position. For example, in Google Trends, Python is well ahead of R. Why?
Python is a top choice for all kinds of data science projects, but it’s the most popular in the financial sector. For instance, The Bank of America picked Python as their tool of choice for crunching financial data.
Here are a few advantages to using Python:
- Less is more. Python makes programs run with the least lines of code possible. To achieve that, it automatically identifies and associates data types and follows an indentation-based nesting structure. Easy to use and versatile, it takes less time to code a solution in Python. R on the other hand is a specialized tool, designed specifically for data analysis.
- One language for everything. Python is universal. It’s quick and powerful with plenty of capabilities. With Python, you can build models, web applications, and anything else you need in one language. That simplifies projects, saving time and money.
- Large number of libraries. If you need more libraries, Python offers a great number of free data science, machine learning, and data analysis libraries. These include Pandas and Scikit-Learn. Pandas provides fast, flexible, and expressive data structures, designed to make working with “relational” or “labeled” data easy and intuitive.
For more info, read our in-depth Python versus R comparative guide.
What does a data scientist do?
Data scientists solve complex data problems using their expertise in scientific disciplines. They use the latest technologies to find solutions. These are then presented in a way that’s much easier to understand than the raw data.
Organizations grapple with tons of disparate data. Transforming that data into actionable insights has a profound impact. Businesses and government agencies are rushing to hire data scientists to enhance their operations.
Data science combines computer science, modeling, stats, analytics, and math. Alongside that, a data scientist has sound business sense. What do they actually do?
Data scientists work with stakeholders to understand the goals of a business and how to achieve them. They design data modeling processes, create algorithms, and predictive models. Using these, they extract business data and help analyze that data.
Each project is different, but the process follows a general pattern. Data scientists:
- Ask the right questions during the discovery process
- Acquire the data
- Process and clean the data
- Integrate and store the data
- Carry out initial data investigation and analysis
- Decide on one or more models and algorithms
- Apply data science techniques such as classification, regression, and segmentation
- Measure and improve results
- Present results to stakeholders
- Make changes based on feedback
- Repeat the above process to solve new problems
Data scientists vs. data analysts vs. data engineers vs. business intelligence
Under the umbrella of data scientist, there are a handful of careers, including:
- Data scientist. Design data modeling processes to create predictive models and algorithms. A data scientist also performs custom analysis and corporate reporting.
- Data analyst. Collect, organize, and manipulate large data sets to identify trends. Conclusions drawn from examining the data inform strategic business decisions.
- Data Scientist: Applied Scientist. This role involves areas like batch / reinforcement learning, metrics and causal inference, explainable AI, and transfer learning for natural language generation.
Other careers are sometimes included in the field, depending on your viewpoint:
Data engineer.- Clean, aggregate, and organize data from different sources. That data is then transferred to data warehouses. Data engineers develop, construct, test, and maintain architectures such as databases and large-scale processing systems.
- Business intelligence specialist. A BI role involves identifying trends and patterns in data sets. BI analysts discover areas of revenue loss and figure out where to make improvements to save the business money or increase profits. That’s achieved by mining complex data using BI software and tools. That data gets compared to competitors and industry trends. BI analysts create visualizations that communicate findings to others in the company.
- Machine Learning Engineer. Defining models and feeding data into them. ML engineers are also responsible for helping to scale theoretical data science models to production-level models that can handle terabytes of real-time data. They work with finer granularity – for example, recommenders and classifiers on a scale.
- Data Steward. This is the lead role in a data governance project. Data Stewards take ownership of data and work to define objectives. Additional responsibilities include schema maintenance and taking care of data formats or errors.
At Netguru, the all these roles fall under a Data Science Unit, including:
- Machine Learning
- Data Engineering
- Data Analytics (more towards corporate reporting)
- Business Intelligence
- Data Science
Why become a data scientist?
According to Glassdoor, a data scientist ranks as one of the best jobs in America. In 2021, it ranked second, in 2020 it was number three, and in 2019 it was top of the list.
Who is data science for? Let’s look at some of the things data scientists do. On a day-to-day basis, data scientists apply a handful of core skills, including:
- Computer science. The ability to apply the principles of artificial intelligence, database systems, numerical analysis, and software engineering.
- Programming. Be adept at writing computer programs and analyzing large datasets to answer complicated issues. Data scientists are comfortable writing code in an array of languages such as Java, R, Python, and SQL.
- Statistical analysis. The ability to identify patterns in data, including pattern and anomaly detection.
- Data storytelling. Be able to talk about actionable insights using data to a non-technical audience.
As well as these technical skills, a data scientist should possess a range of softer skills in certain areas, too. These include communication skills such as connecting with stakeholders and analytical and critical thinking. Data scientists should also be inquisitive and look beyond surface level.
Generally, employers look for data science specialists with advanced degrees, such as a Master of Science in Data Science. Often, data science professionals begin with a degree in computer science or math and build on that with a master’s in data science, data analytics, or other related fields.
While studying for a master’s, the person gains core competencies in areas such as big data, data mining applications, data-driven decision-making, predictive analytics, and statistical modeling.
Machine learning
A core skill for data scientists to possess is often said to be machine learning. ML is a collection of methods that provides software with the ability to learn. It deals with massive sets of data by developing algorithms that can learn by themselves. The algorithms aren’t programmed each and every step of the way.
ML algorithms generate actionable insights on their own. They respond to changes reflected in their data sets such as changing patterns in consumer choices. The goal of machine learning? To make decisions and predictions at a very granular level. Examples of these include recommendations, scoring credit risk, or optimizing a bidding process in marketing campaigns.
At Netguru, we use ML, but we separate it from data science. Why?
Data science allows you to discover the unknown. It indicates where further ML efforts can take place to have the greatest and most tangible impact. Data science is also used to guide you through the future with simulations and forecasts, so you can make data-driven decisions.
For example, decisions such as predicting the impact of a marketing campaign before it’s launched, or handling incoming inquiries before they reach your inbox.
Machine learning on the other hand acts immediately at a granular level. For example, ML makes instant recommendations for a user viewing a set of products in an ecommerce store. Similarly, in an ecommerce setting, ML regularly optimizes keywords for promotions to generate savings, and engages an undecided customer through a chatbot.
For these reasons, we distinguish between the two terms and don’t place machine learning under the data science umbrella.
Data science uses
What is data science used for? Many industry verticals use data science. It helps achieve major goals that weren’t possible or took too much time and energy just a few years ago. For example:
- Anomaly detection in fields such as crime, disease, and fraud.
- Automation and decision-making in areas such as background checks and creditworthiness.
- Classifications in an email server such as flagging emails as important or junk.
- Forecasting in areas such as sales, revenue, and customer retention.
- Pattern detection such as weather patterns and financial market patterns.
- Recognition technology such as facial, voice, and text.
- Recommendations based on learned preferences. For example, recommendation engines refer you to movies, restaurants, and books you may enjoy.
Let’s take a look at a handful more examples of how organizations use data science to innovate and increase efficiency.
Healthcare
Data science has led to several healthcare breakthroughs.
From fighting cancer to preventing disease, data science helps save lives. Researchers and physicians are using healthcare data to understand clinical context, prevent future health issues, and find new treatment options. Data science helps with:
- Research into disease
- Hospital admin process automation
- Detecting illness early
- Preventing unnecessary visits to the doctor
- Predicting disease
- Discovering new drugs
- Greater accuracy with health insurance rates
- Streamlining patient data-sharing
- Personalizing patient healthcare experiences
There are vast networks of data available. These range from EMR data, clinical databases, and personal fitness trackers. Medical professionals are using these to find new ways to understand disease.
Cybersecurity
Data science is incredibly useful in the cybersecurity arena. Why has it become common practice to use data science in this field? Reasons include:
- Hackers use increasingly sophisticated techniques to perform cyber attacks.
- Big data grows and changes at a rapid pace.
- Big data needs science to be useful.
- The “how” of an attack is just as important as the “what.”
Most modern cybersecurity tools use data science and machine learning. For example, they’re used in antivirus software. Data science works alongside machine learning techniques by combing through various patterns and determining which are putting (or could put) your organization at risk.
Every day, international cybersecurity firm Kaspersky uses data science and machine learning to detect over 360,000 new samples of malware. Through data science, it’s possible to instantly detect and learn new methods of cybercrime. Uses like that are essential to our safety and security in the future.
Self-driving cars

Major car manufacturers are using predictive analytics to create a new wave of autonomous vehicles. For example, Mercedes, Volkswagen, Tesla, and Ford are all part of the self-driving car revolution. Using data science, thousands of tiny cameras and sensors relay information in real-time.
Predictive analytics and data science create self-driving cars that can adjust to speed limits, avoid dangerous lane changes, and take passengers via the quickest route.
Finance
Data science and ML have saved the finance industry millions of dollars and crazy amounts of time. How?
Let’s take JP Morgan as an example. Their Contract Intelligence (COiN) platform uses NLP to extract and process crucial data from about 12,000 commercial credit agreements per year.
If humans alone performed that task, it would take a whopping 360,000 manual labor hours to complete. Using data science, it’s finished in just a few hours.
Furthermore, fintech companies like PayPal and Stripe are investing heavily in data science. They’re using it to create tools that detect and prevent fraudulent activities.
Logistics
Let’s take UPS as an example. Founded in 1907, they make more than 16 million shipments to over 8.8 million customers globally on a daily basis. They’re using data science to maximize efficiency. How? By applying it both internally and along their delivery routes.
In the past, gathering, analyzing, and deploying data sat firmly within specialized teams. These days, organizations like UPS ensure both frontline workers and leadership have a high-level understanding regarding the value of data.
For example, UPS’s on-road integrated optimization and navigation (ORION) tool uses data science-backed statistical modeling and algorithms. These create optimal routes for delivery drivers based on things like traffic, weather, and construction.
It’s estimated that ORION alone saves UPS about 100 million miles, 10 million gallons of fuel, and $50 million every year.
Furthermore, UPS’s supply chain solutions team uses data to design the most efficient models across areas such as sourcing, manufacturing, and transportation. Also, customer experience uses a data-driven tool to analyze and troubleshoot the client journey. For instance, their network planning tools predict and forecast customer needs.
Advanced analytics is central to UPS’s research and development efforts. They help evaluate future networks and last-mile technology changes for operating margins and sustainability.
Entertainment
Have you ever wondered how Netflix recommends an array of programs for you to watch? Or how Spotify selects songs for you?
They both use data science. Spotify uses it to create a playlist for you based on the music genre or band you currently listen to.
Netflix uses a data aggregator to identify the types of programs you’ve watched recently. For example, if sci-fi is top of your list, Netflix recommends relevant shows from its back catalog.
Other noteworthy applications of data science in entertainment and media include:
-
Personalized marketing
-
Customer sentiment analysis
-
Real-time analytics
-
Content distribution on social media
-
Object detection and classification
-
Collecting and analyzing customer insights
-
Leveraging mobile and social media content
-
Analysis of media content usage
Data science summary
According to a recent report by Dice, in 2020, demand for data scientists increased by an average of 50% across healthcare, telecommunications, media, finance, and insurance.
Data scientists dramatically help businesses improve the effectiveness and efficiency of their processes and operations. Increased demand gives data scientists greater scope to demonstrate their skills and capabilities.
A career in data science takes dedication and a passion for data. Data scientists also have a unique curiosity regarding problem-solving. It’s a challenging but rewarding path with roots in math, statistics, and computer science.
The Bureau of Labor Statistics places data science in the top 20 fastest-growing professions. The department projected 31% growth over the next decade.
An eclectic array of industries use data science, and that will undoubtedly continue this year and beyond. If your business is looking to utilize data science and would like a consultation, get in touch with us.
Grzegorz Mrukwa
Grzegorz is a Data Science Manager at Netguru. Drawing from years of commercial and academic experience, Grzegorz helps our clients to discover how data can empower their business.