
Business value of design: What the evidence shows and its limits


Contents
The business value of design is best supported by one widely cited correlation: McKinsey's 2018 finding that companies with the strongest design practices outgrew their peers on revenue and shareholder returns.
That evidence is useful for executive buy-in but cannot prove cause, so a design budget needs a second layer: levers you can measure in your own data, such as conversion, retention, support cost and rework.
The strength of the case depends on how much decision authority design has and whether findings can reach the product.
What is the business value of design?
The business value of design shows up in revenue, retention, and delivery cost when a team sets targets for it and tracks them like any other function.
Without owners and metrics, design spend gets judged on taste and is hard to defend in a budget review.
We recommend starting with your own data (UX-tagged defects, late-stage rework, support tickets by cause) before borrowing McKinsey's figures, because that baseline is the one your finance team can audit. If you need a partner for that work, Netguru offers product design and design system services.
What did McKinsey's business value of design study find?
McKinsey's business value of design study found that top-quartile design performers beat industry peers by 32 percentage points on revenue growth and 56 percentage points on total returns to shareholders (TRS).
The October 2018 report, The business value of design, tracked about 300 publicly listed companies in several countries for five years, in medical technology, consumer goods and retail banking. McKinsey reports more than two million pieces of financial data and over 100,000 design actions behind the index.
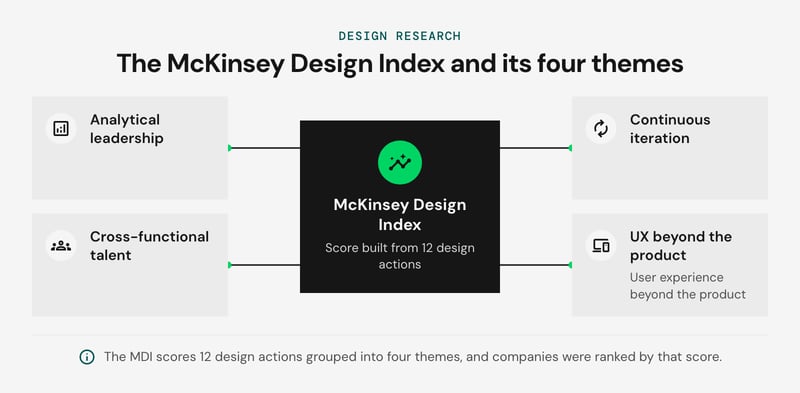
The McKinsey Design Index (MDI) is a score built from 12 design actions grouped into four themes: analytical leadership, cross-functional talent, continuous iteration, and user experience beyond the product. Companies were ranked by MDI score. The headline gap compares the top quartile with industry peers over the same five-year window.
Both figures are percentage-point gaps against peers, not growth rates. A 32-point revenue gap means top-quartile companies accumulated 32 points more growth than their industry benchmark over the period. It does not mean revenue grew 32 percent. The same applies to the 56-point TRS gap. Quoting either as "32% growth" or "56% returns" misstates the study.
Treat the result as the strongest public benchmark for why design maturity and financial performance travel together, not as a forecast for your own P&L. For the methodology and charts, use McKinsey's article page. It is the source for the full report PDF, so you don't need a third-party copy or a summary.
What the study does not prove
The McKinsey Design Index (MDI) study shows that strong design practices and above-peer financial results coincided in one sample, and it does not prove that design caused those results. Correlation versus causation is the first limit, and three more follow.
- Reverse causality. Fast-growing, profitable companies can afford larger design teams, research budgets and the patience for continuous iteration. The same data fits design driving growth, growth funding design, or a third factor such as strong management producing both. An observational index cannot separate these.
- Listed companies only. The sample covers publicly listed companies in three industries. Venture-backed startups, private firms and other industries sit outside it, so a scale-up applying the result is extrapolating.
- A score built from practices. The MDI rates how companies work on design. It does not record customer outcomes such as task success rate or retention, so a company can score well on process and still ship a weak checkout.
- One window, now dated. The data covers a single five-year period and was published in October 2018. It says nothing about how the gap has moved since.
- A proprietary index. The MDI is McKinsey's own scoring model, so the scores cannot be checked from outside.
The Design Management Institute's Design Value Index dates from 2015 and is no longer updated. It cannot support a claim about current performance, so cite it only as historical context and give the year.
We recommend using the study's headline gaps as a directional argument for the board. Then build your own case with a before-and-after test on one flow, tracking task success rate and conversion for the redesigned flow against a control.
Which four practices separate top design performers?
McKinsey tied top-quartile design performers to four practices: analytical leadership, cross-functional talent, continuous iteration, and user experience beyond the product. Each practice pays off only if a specific organizational condition already exists.
The table below is our own decision rule, not McKinsey's. It lists what to check before funding each practice and what breaks if the check fails.
| Practice | Check before funding | Operating consequence if it fails |
|---|---|---|
| Analytical leadership | A named leader owns design metrics (task success rate, conversion, retention) and has decision rights over roadmap trade-offs | Dashboards get reviewed, nobody can act on them, and design spend stays a discretionary line item |
| Cross-functional talent | Designers, engineers, and product or marketing staff share teams and goals | Design hands over specs late, and the rework lands in development |
| Continuous iteration | The release cadence lets a team ship, measure, and change something within one planning cycle | Research findings pile up with no release to land in |
| User experience beyond the product | Design scope and budget authority cover onboarding, support, billing, and other touchpoints outside the core interface | The product is polished, but customers still hit disjointed handoffs elsewhere |
We recommend funding analytical leadership first. Measurement gives you the evidence to defend the other three, and it also tells you which condition in the table is weakest in your organization.
The correlation caveat from the previous section applies here too. These are practices that high-scoring companies shared, and a company that copies them is not guaranteed the same financial result. If you cannot meet a condition yet, such as a release cadence slower than your research cycle, fix that before adding design headcount.
How does design drive business value?
Design drives business value through six levers: conversion, retention, support cost, time to market, rework, and brand. Each moves a different cost or revenue line, and each shows up on a different delay.
The table maps them to the UX metrics that track them. The delays are our judgment for a typical product team, not benchmarks.
| Lever | Line it moves | Leading UX metric | Delay before it shows |
|---|---|---|---|
| Conversion | Revenue | Task success rate, conversion rate on key flows | Weeks, once an A/B test has enough traffic |
| Retention | Revenue (renewals, expansion) | Cohort retention, CSAT | Two to four quarters |
| Support cost | Cost of service | Support ticket volume per active user | One to two release cycles |
| Time to market | Delivery cost, revenue timing | Design-to-ship lead time | The next project |
| Development rework | Engineering cost | Share of sprint capacity spent on post-handoff changes | Within the sprint |
| Brand | Price, acquisition | Brand tracking, NPS | Slowest, and hardest to attribute |
Conversion is the fastest lever and the narrowest. Checkout is the clearest case: The average documented online cart abandonment rate is 70.22%, calculated as the unweighted average of 50 studies published 2006-2025 (Baymard Institute, 2026).
A website or product flow also tells a buyer what the company stands for before sales speaks to them. A pricing page that answers the buyer's question builds that impression, and the same page lifts conversion.
Rework and time to market share a mechanism. Design validated before build cuts both cost and calendar time, because a quick MVP tests the riskiest assumption first. The ROI of design systems depends on how often teams reuse components.
Retention is slower because it compounds. Designers map and improve every interaction a customer has with the company, and that sequence forms the customer experience (CX). CSAT measures satisfaction at specific touchpoints, and NPS measures the loyalty that follows.
We recommend starting with rework and support ticket volume. Both have short delays and data you already hold in your issue tracker and help desk. Retention and brand take several quarters to move, so budget for that wait before you promise results.
What is the value of UX design?
The value of UX design concentrates in flows where task success gates revenue or cost: checkout, onboarding, and support deflection. Fund research there first, because a failed task in those flows shows up as a lost order, an abandoned trial, or a support ticket.
Before funding that research, define a UX strategy that ties each study to a business goal, so the work targets the flows where outcomes are measurable.
Each flow pairs one UX metric with one business line:
- Checkout: task success rate for completing a purchase, read as step-level conversion rate in product analytics.
- Onboarding: task success rate for reaching the first valuable action, read as activation and then retention by cohort.
- Support deflection: task success rate in self-service flows, read against ticket volume on the same topic.
Product analytics finds the step where users drop. Usability testing explains why, which analytics cannot do. Task success rate is the effectiveness component of usability in ISO 9241-11, so it ties to a standard definition.
A practical funding rule: instrument checkout, onboarding, and self-service support in product analytics, find the step with the steepest drop in task success rate, and run usability testing on that step before touching anything else. Those flows link UX metrics directly to revenue, retention, and support cost.
The rule weakens in two cases. Low-traffic products rarely reach statistical significance on conversion differences, so lean on usability testing and qualitative findings. Flows where nothing is gated, such as content browsing, deliver value mostly through brand, which is harder to attribute. For help setting up research and measurement, see Netguru's UX design services.
What is the business value of design thinking?
The business value of design thinking comes from invalidating weak ideas early: a usability test on a prototype costs days of team time, while a failed release can cost a quarter of engineering.
That gap is illustrative, and the real ratio depends on your release process. The saving is largest on new products, where the riskiest assumption concerns user behavior, and it shortens the route to an MVP because fewer wrong features get built.
The value stalls when validated concepts have no path into the engineering backlog. Workshops that end in a slide deck produce insight but no shipped change. Three practices close the gap:
- Engineers and product owners join discovery, so cross-functional talent shapes what gets tested.
- Prototype components map to the design system, so handoff becomes code reuse.
- Continuous iteration continues after launch, with product analytics checking that the tested behavior holds in production.
The stages themselves are covered in our design thinking process guide.
The method has limits. For compliance-driven builds or incremental changes to a proven flow, discovery workshops add calendar time without invalidating anything. We suggest reserving them for high-uncertainty bets.
How to measure the business value of design
To measure the business value of design, assign each value lever one metric, one data source and one attribution method before the work ships. The table below is the minimum set we recommend for a product team with working product analytics.
| Value lever | Metric | Data source | How to attribute |
|---|---|---|---|
| Conversion | Funnel conversion rate, task success rate (ISO 9241-11 effectiveness) | Product analytics, moderated usability tests | A/B testing with a holdout group |
| Retention | Day-30 and day-90 cohort retention | Product analytics | Staggered rollout, compare cohorts by exposure to the new flow |
| Support cost | Support ticket volume per 1,000 active users, tagged by topic | Help desk export | Compare only the tagged topics the redesign touched |
| Time to market and rework | Design-to-release cycle time, share of tickets reopened for design reasons | Issue tracker, design system metrics | Compare similar projects with and without shared components |
| Experience and brand | CSAT, NPS | Surveys | Trend against an unexposed segment |
Before/after comparisons are the weakest option in the table. A pricing change, a campaign that shifts traffic mix or a seasonal peak can move conversion by more than a redesign does, and the report will credit design anyway. If you must compare periods, normalize to active users and name every other change shipped in the window.
A/B tests fail differently: they are underpowered at low volume. Assume a 3% baseline conversion rate and a target of detecting a 10% relative lift (3.0% to 3.3%) at 80% power and a 5% significance level. That needs roughly 53,000 visitors per variant, an illustrative calculation. A site with 10,000 monthly visitors would need more than ten months.
Below that volume, use larger changes, a staggered rollout or task success rate in moderated usability tests. Five to eight participants will not prove a revenue effect, but they expose the failures that explain it.
A leading indicator that moves early, such as completion of the redesigned flow, also lets you report before conversion data matures.
McKinsey's index is a correlation across about 300 companies, so it cannot stand in for your own attribution. Report your numbers per lever, with the confounders named, and tie them to cost avoided or revenue gained as described in our guide to UX ROI.
What does design maturity look like at each stage?
Our design maturity model has four stages, and each stage points to one metric to report and one investment to make next. We define the stages by how design work is organized in the product team.
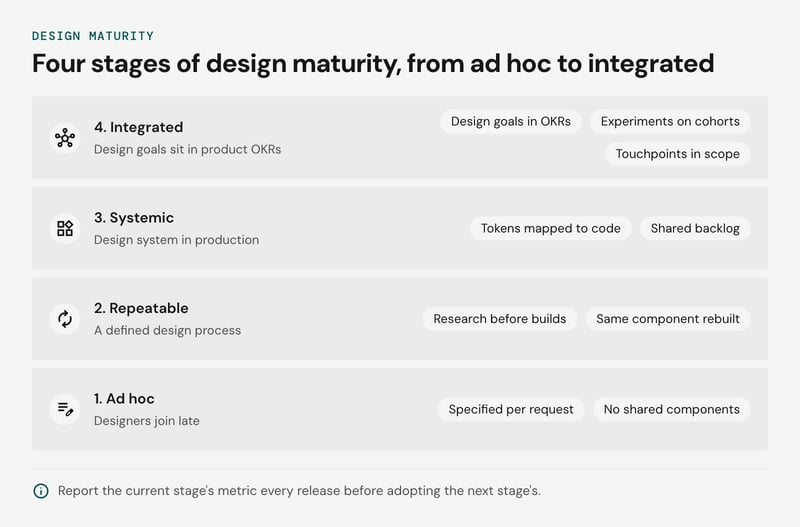
It is a working scale we propose, not a validated index.
The stages side by side:
| Stage | What it looks like | Measure first | Fund next |
|---|---|---|---|
| 1. Ad hoc | Designers join late, screens are specified per request, no shared components | UX-tagged defects per release; task success rate on the three highest-traffic flows | Usability testing on those flows; a designer in sprint planning |
| 2. Repeatable | A defined design process, research before major builds, the same component rebuilt across screens | Rework hours on design-related tickets; task success rate before and after each release | A design system core: components plus design tokens for color, type, and spacing |
| 3. Systemic | Design system in production, tokens mapped to code, design and engineering share a backlog | Component adoption rate, handoff time, token coverage (see design system metrics) | System upkeep: a named maintainer, versioning, a contribution path |
| 4. Integrated | Design goals sit in product OKRs, experiments run on cohorts, touchpoints beyond the product are in scope | Conversion rate and retention by cohort; support contact rate per feature | Design ops, experimentation capacity, ownership of the cross-channel journey |
The rule we recommend: report the current stage's metric every release before adopting the next stage's. A team at stage 1 that promises retention attribution has no baseline to attribute against, and the first quarter of data will be noise.
Moving from stage 1 to 2 is mostly a matter of running the same design process on every major build.
Skipping stage 3 is a legitimate choice. A single product with one front end and a small team may spend more maintaining a token pipeline than the rework it removes. Check your rework hours at stage 2 before committing a maintainer.
Does a design system shorten time to market?
A design system shortens time to market by removing repeated decisions: components, patterns and design tokens are built once, then reused across screens and products. The evidence is strongest for design and build phases and thinner for the full release cycle.
Design tokens store color, spacing and type values as named variables shared by design files and code. A brand or accessibility change then lands in one place instead of on every screen. Engineers pull tested components instead of rebuilding them, which cuts handoff questions and visual rework.
Netguru's own design system, Silk, gives one data point. The design of a 2024 native app MVP took three months with Silk, against six months for a comparable 2021 project without it, and rapid prototyping took half the time on projects using Silk.
Treat that as one team's evidence, not a benchmark. The two projects were different products built three years apart, so tooling and team changes are mixed in with the effect of the system. Payback also depends on reuse.
With one product and a UI that changes weekly, the upfront cost of building the system can exceed the saving, and we'd suggest waiting until at least two teams share the same components.
To test the effect in your own team, track lead time from design handoff to merged code, component reuse rate, and design-related rework tickets before and after adoption. Our guide to the ROI of design systems covers the cost model, and the design system metrics article lists the measures in detail.
What other evidence supports the McKinsey finding?
Other dated studies support the direction of the McKinsey Design Index (MDI) finding, but none turns it into proof that design causes outperformance.
The MDI links stronger design practice to faster revenue and total returns to shareholders growth. Every other source we can name measures an association, so none settles whether design drives the results or whether healthy companies fund design better.
The sources that can be dated and retrieved, set against the 2018 study:
| Source | Year | What it measured | Against the MDI |
|---|---|---|---|
| Hertenstein, Platt and Veryzer, *Journal of Product Innovation Management* | 2005 | Industrial design effectiveness and corporate financial performance | Agrees on direction. Predates the MDI and covers industrial design only, a narrower scope. |
| Design Management Institute Design Value Index | 2015 | Stock performance of design-led companies against a broad market index | Agrees on direction. The index is no longer updated, and its company list was chosen by the researchers. |
These sources and the MDI agree on direction and share the same weakness. Each compares companies that already invest in design with those that don't, which leaves room for reverse causation: profitable firms can afford design leadership, and strong management can drive both outcomes. McKinsey's own article describes the MDI as showing a relationship between design and financial performance.
A replication of the MDI method on a newer sample is not something we can point to, so treat the 2018 figures as a dated snapshot of 2013-2018. We recommend using them to justify running a design maturity assessment, then proving value on your own metrics. Metric-level evidence, such as conversion and retention lift, is covered in UX ROI.
When does design investment not pay off?
Design investment does not pay off when designers cannot change the product, when their findings have no route into engineering, or when no one has confirmed customers want what is being designed.
The conditions below are our judgement from how design work is organized, not findings from a named study. Each has an early sign you can check this quarter.
| Condition | Why returns stall | Early sign |
|---|---|---|
| No authority to change the product | Designers recommend and roadmap owners decide, so usability findings compete with feature requests and lose | Findings sit in the backlog for more than a quarter |
| No engineering path for findings | Fixes arrive as mockups with no ticket, owner or release slot, so shipped screens drift from the design and development rework grows | Sprints keep reopening screens already marked done |
| Unvalidated demand | A polished flow for a feature nobody needs raises task success rate without moving conversion or retention | Task success improves while adoption stays flat |
| Too few users to test | Low traffic means A/B tests never reach significance, and quantitative usability testing yields anecdotes | Results flip between test rounds |
| Design judged only on aesthetics | Reviews score look and feel, and no one owns a metric | Design reviews show no baseline number |
| Unmaintained design system | Components fall behind the code, teams fork them in their own repositories, and the system becomes a maintenance cost | Two teams ship different versions of the same button |
Low traffic is the one condition with a partial workaround. Moderated usability testing with a handful of participants still finds usability problems. What it cannot do is prove a lift in conversion, so report it as qualitative evidence.
McKinsey's term analytical leadership, meaning design tracked with the same rigor as revenue and cost, addresses the fifth row directly. The MDI shows an association between that practice and top-quartile performance, not that adopting it causes the result. Where several of these conditions hold at once, we recommend fixing decision authority and the engineering handoff before funding more research.
FAQ
What is the McKinsey Design Index?
How much did top design performers outgrow peers?
How does design impact business growth?
How can experience design drive business value?
Is the Design Value Index still current?
Using the evidence to build your case
Build your case by pairing the McKinsey Design Index (MDI) with your own UX metrics: task success rate, conversion rate and retention, each measured against a pre-release baseline.
The MDI shows a correlation across about 300 companies. It supports the argument for investing, and your cohort data shows whether design moved your numbers. We suggest starting with one product flow, recording the baseline, and reporting the change at 30 and 90 days.
If you want help choosing that first flow and setting up its baseline, tell us about your product and our designers will look at it with you.


