
Performance testing tools: How to pick by job, language and CI fit


Contents
Performance testing tools split into two groups that answer different questions: protocol-level load tools such as k6, JMeter, Gatling, Locust and Artillery, and browser tools such as Lighthouse, WebPageTest and sitespeed.io. The right pick follows from your team's language, the protocols you must hit, where the test runs in CI, and how the licence scales with load.
Most teams need one tool from each group, not six trials. The choice changes only if you need legacy protocols or vendor-backed support at very large scale.
Which tool fits which team
Match the tool to who will write and review the tests. k6 suits JavaScript teams that gate CI on thresholds, because tests live in the repo as code. Apache JMeter suits QA teams that need JDBC, JMS or LDAP alongside HTTP and prefer a GUI. Gatling suits JVM teams that want code-reviewed scenarios and high concurrency per machine.
Lighthouse audits front-end performance for a single page, and its score does not predict behavior under concurrent load.
We recommend starting with k6 for load tests and Lighthouse for front-end budgets, because both run in CI with explicit pass/fail thresholds.
The pick shifts with skills: Python teams may prefer Locust, and enterprises with legacy protocols may need LoadRunner. If the team lacks those skills, Netguru's staff augmentation adds QA and DevOps engineers who already work with k6, JMeter or Gatling.
What are performance testing tools used for?
Performance testing tools simulate user traffic against an application to find which load level breaks a latency, throughput, or error target. ISO/IEC 25010 files this under performance efficiency (iso25000.com - ISO 25010 Standard, 2023).
Each test type answers one question and fails on one metric:
| Test type | Question it answers | Fails when |
|---|---|---|
| Load | Does the system hold its targets at expected peak? | p95 latency or error rate crosses the agreed threshold |
| Stress | Where does it break, and how does it fail? | p99 climbs steeply, errors rise, throughput plateaus |
| Spike | Does it absorb a sudden surge and recover? | Errors during the surge, or p99 slow to return to baseline |
| Soak | Does it stay stable over hours? | p95 drifts upward, memory or connections grow |
Set pass/fail on p95 and p99 latency percentiles, never on the mean. A mean of 200 ms can sit alongside a p99 of several seconds, and the slowest 1% of requests is often where checkout or login timeouts occur. An illustrative gate is p95 under 500 ms with errors under 1% (Gatling blog on detecting performance regressions).
Distributed load generation matters once a single generator saturates its CPU or network, because the results then measure the generator and not the application.
Front-end tools such as Lighthouse and sitespeed.io cover single-page rendering and Core Web Vitals.
Decision table: Performance testing tools by language, protocol and CI fit
Pick k6 or Locust for API load tests in a code-first team, JMeter for multi-protocol coverage, Gatling for JVM shops, and Lighthouse or WebPageTest for browser metrics. Load tools generate traffic and report p95 and p99 latency percentiles.
Browser tools measure what one page costs a real user.
Licences and latest releases were checked against each project's repository in November 2026: k6 2.3.0, Apache JMeter 5.6.3, Gatling 3.16.0, Locust 2.47.0, Artillery 2.0.34, Lighthouse 13.6.0 and sitespeed.io 42.10.0.
Protocol and API load testing:
| Tool | License | Scripting | Protocols | Distributed | CI fit | Best fit |
|---|---|---|---|---|---|---|
| k6 | AGPL-3.0 | JavaScript | HTTP, WebSocket, gRPC | k6-operator on Kubernetes, or Grafana Cloud k6 | CLI thresholds set the exit code | Dev-owned API tests with arrival-rate scenarios |
| Apache JMeter | Apache 2.0 | GUI, XML plans, Groovy | HTTP, JDBC, JMS, LDAP, SMTP, TCP | Built-in controller and workers | Non-GUI mode, Maven plugin | QA teams testing mixed protocols |
| Gatling | Apache 2.0 (open-source edition) | Java, Kotlin, Scala, JS/TS | HTTP, WebSocket, SSE, gRPC, JMS, MQTT | Gatling Enterprise (commercial) | Maven, Gradle and sbt plugins | JVM teams with code-reviewed simulations |
| Locust | MIT | Python | HTTP; others via custom clients | Built-in master and workers | Headless mode | Python teams, custom user behavior |
| Artillery | MPL-2.0 | YAML plus JS | HTTP, WebSocket, Socket.io, gRPC | AWS Lambda or Fargate from the CLI | CLI, YAML in repo | Node teams wanting low setup |
| OpenText LoadRunner | Commercial | C, JavaScript, Java | Web, SAP, Citrix and many more | Controller and load generators | Supported, heavier setup | Enterprises with legacy protocols |
Browser and front-end performance:
| Tool | License | What it measures | CI fit | Best fit |
|---|---|---|---|---|
| Lighthouse | Apache 2.0 | Lab Core Web Vitals and audits for one URL | Lighthouse CI | Per-pull-request regression checks |
| WebPageTest | Free public instance, paid plans | Real-browser waterfalls from chosen locations | API and CLI | Diagnosing slow pages by region and network |
| sitespeed.io | MIT | Repeated runs, trends, budgets | Docker image | Long-term front-end dashboards |
Google's Core Web Vitals "good" thresholds are LCP at or under 2.5 s, INP at or under 200 ms and CLS at or under 0.1, measured at the 75th percentile of page loads (web.dev).
Lighthouse also powers PageSpeed Insights, which reports a URL's performance on mobile and desktop and suggests fixes. We recommend running Lighthouse or sitespeed.io in CI on every pull request, so front-end regressions surface during development. Keep a load tool in a separate pipeline stage.
For mobile, see our guides to mobile app performance testing and Android performance testing tools. For LLM-backed endpoints, see performance testing in AI projects.
Which tools handle protocol and API load testing?
k6, Apache JMeter, Gatling, Locust, and Artillery all handle HTTP API load testing for free, and they differ in scripting language, protocol reach, and the point where each one fails first.
The open-source cores run in CI with no license cost. Paid tiers mostly add managed cloud runners and dashboards. The table lists what breaks first and when we would not pick each tool.
| Tool | Engine and scripting | Where it breaks first | When we would not pick it |
|---|---|---|---|
| k6 | Go engine, JavaScript tests (k6 repository) | Native protocols are HTTP, WebSocket, and gRPC; anything else needs an xk6 extension built into a custom binary. Scripts run in k6's own JS runtime, not Node, so npm packages need bundling. | Tests need JDBC or JMS, or you want to reuse Node libraries. |
| Apache JMeter | Java, plans stored as XML (JMX) | Each virtual user is a thread, so memory cost forces more load generators as concurrency grows. JMX diffs are unreadable in code review. | The team reviews tests in pull requests, or needs high concurrency from few machines. |
| Gatling | JVM engine; Java, Kotlin, Scala, and JavaScript/TypeScript SDKs (Gatling repository) | JVM warm-up skews the first seconds of a run. The open-source edition leaves multi-machine orchestration to you. | There is no JVM build tooling, or you need managed distributed runs without paying for Gatling Enterprise. |
| Locust | Python (Locust repository) | One worker process saturates one core, so you run a worker per core. HTTP is built in; other protocols need custom clients. | You need very high request rates from a single machine. |
| Artillery | Node.js, YAML scenarios with JS hooks (Artillery repository) | Engines cover HTTP, WebSocket, Socket.IO, and gRPC, with nothing for JDBC or JMS. Branching logic gets awkward in YAML. | You need database or message-broker load, or complex scenario logic. |
JMeter stays the broadest option. It covers HTTP, JDBC, JMS, LDAP, and more, and a tester without extensive programming knowledge can build plans in the GUI or run them from the CLI. Use the GUI for authoring and non-GUI mode for CI runs.
The workload model affects your p95 and p99 latency percentiles. JMeter's default thread groups and Locust's default users are closed models: when the system slows down, virtual users wait and send fewer requests, which flatters tail latency. k6, Gatling, and Artillery can inject by arrival rate, so we recommend them when the test must reflect real traffic.
Distributed load generation also differs by tool. JMeter uses remote engines, Locust uses leader and worker processes, k6 runs on Kubernetes through its operator, and Artillery can fan out to AWS Lambda or Fargate.
Our view: start with k6 for a new API test suite, Gatling in a JVM shop, and Locust where Python is already the team's language. Choose JMeter when protocol breadth is a hard requirement, and Artillery for Node teams testing WebSocket or Socket.IO traffic.
k6: Strengths and limits
k6 is a strong fit for API load testing in CI because k6 thresholds turn latency and error budgets into a pass/fail exit code, and its arrival-rate executors hold request rate steady when the system under test slows down (Grafana k6 documentation: Options reference, 2025).
export const options = {
  scenarios: {
    api: {
      executor: 'constant-arrival-rate',
      rate: 50,
      timeUnit: '1s',
      duration: '5m',
      preAllocatedVUs: 100,
      maxVUs: 300,
    },
  },
  thresholds: {
    http_req_duration: ['p(95)<400', 'p(99)<1000'],
    http_req_failed: ['rate<0.01'],
  },
};
If p95 exceeds 400 ms, p99 exceeds 1 s, or more than 1% of requests fail, k6 exits with a non-zero code (99 for threshold failures) and the pipeline step fails. The 400 ms, 1 s and 1% values are illustrative; set them from your own SLOs.
The executor choice matters as much as the thresholds. Closed models such as constant-vus or ramping-vus wait for each response, so a slow server lowers the request rate and flatters the percentiles. Arrival-rate executors keep sending, and dropped_iterations tells you when maxVUs was too low.
The limits are protocol reach (HTTP, WebSocket and gRPC are covered, JDBC and JMS are not), a Go-based JavaScript runtime that does not run arbitrary npm packages, and AGPL-3.0 licensing that legal teams sometimes want reviewed.
Distributed load generation in the open-source version means running the k6 Operator on Kubernetes. Grafana Cloud k6 adds managed runners and dashboards on a paid tier.
.NET performance testing tools
For .NET performance testing, drive the service over HTTP with k6 or Apache JMeter, because both are protocol-level tools that don't depend on the language the server runs.
k6 scripts are JavaScript and JMeter plans run on the JVM, so neither needs a .NET SDK or a build change in your application. Locust works the same way if your team already writes Python.
Gatling has no .NET SDK, so a .NET team using it would script in Java, Kotlin, Scala or TypeScript.
Keep profilers in a separate step. A load tool shows that p95 or p99 latency breached its threshold. A profiler such as dotnet-trace, dotnet-counters, or PerfView then shows which allocation, lock, or query caused it. NBomber is a C#-native load tool for teams that want tests in the solution; check its licence terms for commercial use.
Which tools measure browser and front-end performance?
Lighthouse, WebPageTest, and sitespeed.io measure browser and front-end performance: how quickly one real browser renders a page and how it scores on Core Web Vitals. They show what a single visitor experiences, so they sit beside load tools and don't replace them.
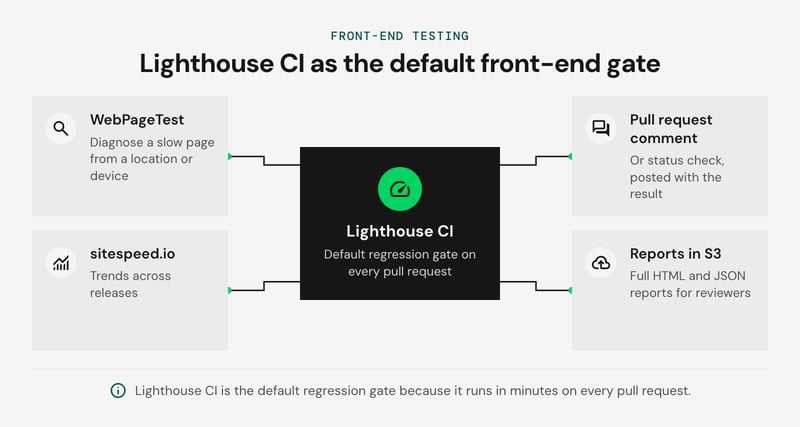
The three tools side by side:
| Tool | What it does | CI fit |
|---|---|---|
| Lighthouse | Audits a URL on mobile and desktop profiles and suggests fixes | Lighthouse CI runs per pull request with assertions on budgets |
| WebPageTest | Runs tests in real browsers from chosen locations, with waterfalls and filmstrips | UI for investigation, API and CLI for automation |
| sitespeed.io | Open-source runner that drives browsers and stores metrics over time | CLI and Docker image, with dashboards for trends |
We recommend Lighthouse CI as the default regression gate, because it runs in minutes on every pull request. Configure several runs per URL and assert on the median, since single Lighthouse runs vary. Post the result as a pull request comment or status check, and upload the full HTML and JSON reports to an S3 bucket so reviewers can open the detail.
Add sitespeed.io when you need trends across releases, or WebPageTest when you need to diagnose a slow page from a specific location or device. Lighthouse reports Total Blocking Time as a lab proxy for Interaction to Next Paint, so confirm responsiveness against field data.
A Lighthouse score is a single-user measurement taken on one machine. A page can score well and still degrade when hundreds of sessions hit the same API, because queueing and database contention appear only in p95 and p99 latency under concurrent load.
Pair the browser tools with a protocol-level load test from the earlier section, and treat the two as answers to different questions. Browser tools catch heavy bundles, unoptimized images, and render-blocking scripts. Load tools catch server-side saturation.
How do JMeter, Gatling and LoadRunner compare?
Apache JMeter, Gatling, and OpenText LoadRunner differ most in scripting model, resource use per load generator, and cost. JMeter and the Gatling core are free open source, while LoadRunner is a licensed commercial suite.
The three side by side:
| Apache JMeter | Gatling (open source and Gatling Enterprise) | OpenText LoadRunner | |
|---|---|---|---|
| Scripting | GUI test plans saved as XML, run from the CLI | Code: Java, Kotlin, Scala, JavaScript or TypeScript | VuGen recorder and scripts in C, JavaScript and other languages |
| Resource use per generator | Thread per virtual user; CPU and memory climb with large user counts | Asynchronous engine; fewer resources per generator at high concurrency | Heavy agents, sized per license and controller setup |
| Protocols | HTTP, JDBC, JMS, LDAP, FTP, SMTP | HTTP, WebSocket, SSE, gRPC, JMS, MQTT | Broad set including legacy enterprise protocols |
| Reporting | Built-in HTML dashboard | HTML reports; live dashboards in Gatling Enterprise | Dedicated Analysis component |
| Cost model | Free (Apache License 2.0) | Free core; Gatling Enterprise priced by plan | Commercial license, virtual-user based |
JMeter's CPU and memory utilization can be very high for a large number of users, so teams usually add distributed generators earlier than they would with Gatling.
We recommend Gatling when the team writes code, keeps tests in version control, and wants high concurrency per machine. Choose JMeter when QA staff need a GUI and broad protocol coverage at no license cost. Choose LoadRunner when you test legacy enterprise protocols and need vendor support.
A caveat on cost: Gatling Enterprise and LoadRunner both charge for distributed runs and reporting, so compare them against the engineer time you would spend building that yourself on open source.
Netguru is a services partner, not a tool vendor, so we pick among these tools per project.
How do you run performance regression tests in CI?
Run performance regression tests in CI by giving every pipeline a short load test with hard p95 and p99 latency thresholds, and failing the build when they break.
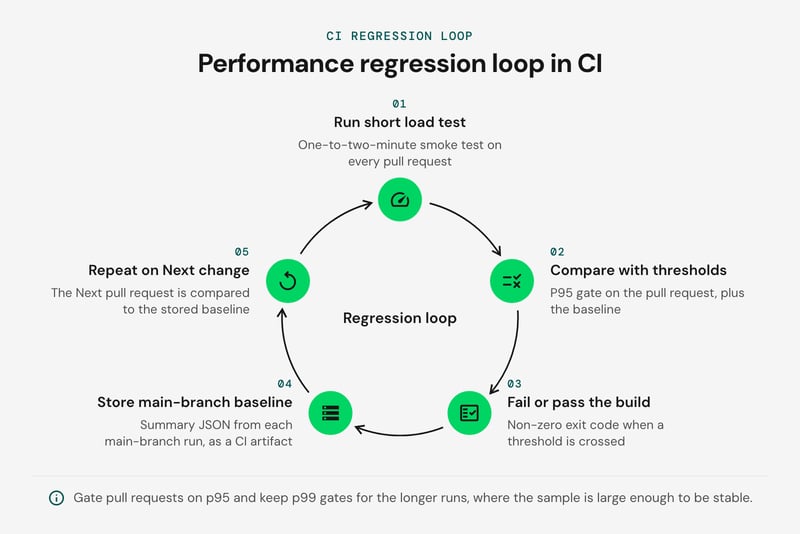
k6 thresholds do this natively. The process exits with a non-zero code when a threshold is crossed, so the CI job fails without any result parsing.
export const options = {
  scenarios: {
    api: {
      executor: 'constant-arrival-rate',
      rate: 50, timeUnit: '1s',
      duration: '2m', preAllocatedVUs: 100,
    },
  },
  thresholds: {
    http_req_duration: ['p(95)<300', 'p(99)<800'],
    http_req_failed: ['rate<0.01'],
  },
};
Gatling expresses the same gate as assertions on the simulation, and the run fails when one does not hold.
setUp(scn.injectOpen(constantUsersPerSec(50).during(120)))
  .protocols(httpProtocol)
  .assertions(
    global().responseTime().percentile(95).lt(300),
    global().failedRequests().percent().lt(1.0)
  );
Teams with existing JMeter plans can wrap them in Taurus and declare pass/fail criteria in YAML, which avoids rewriting scripts to get a gate. All threshold values above are illustrative; derive yours from your latency SLO.
Absolute thresholds catch large regressions but miss slow drift. For drift, store the summary JSON from each main-branch run as a CI artifact and fail a pull request when its p95 is worse than that baseline by an agreed margin, for example 10% (an illustrative value).
A cadence we suggest is a one-to-two-minute smoke test on every pull request, a longer run on merge to main, and a soak test overnight. Gate pull requests on p95 and keep p99 gates for the longer runs, where the sample is large enough to be stable.
Shared runners add noise. When the load generator and the app under test share one CI runner, they compete for CPU, and p99 then tracks runner load more than code changes. Deploy the app to an ephemeral environment, watch generator CPU during the run, and rerun once before failing on a p99 breach.
Load tools do not render pages, so pair them with the Lighthouse CI gate described in the browser section.
When do commercial and enterprise platforms pay off?
Commercial platforms pay off when running distributed load generation yourself costs more engineering time than a license, or when the test needs protocols and governance that open source doesn't ship.
Three meters drive the bill: VU-hours (you pay for virtual users multiplied by test duration), load-generator hours (you pay for the machines), and seat or concurrent-VU licenses (you pay for capacity whether or not you run tests).
Open-source runs avoid the license but not the generator cost. CPU and memory climb quickly at large user counts, especially on thread-per-user engines such as Apache JMeter, so high-concurrency runs still consume instance hours and tuning time.
What each paid layer adds over its open-source core:
| Platform | Open-source core | What the paid layer adds | Usual meter |
|---|---|---|---|
| Grafana Cloud k6 | k6 | Managed generators in multiple regions, stored results, team dashboards | VU-hours |
| Gatling Enterprise | Gatling | Injector orchestration (cloud or self-hosted), run history, trend comparison | Plan tier plus generator usage |
| BlazeMeter | Runs JMeter, Gatling, k6, and Locust scripts | Managed scaling, shared reporting, test management | Tiered plans by concurrency |
| OpenText LoadRunner | None (commercial) | Broad enterprise-protocol coverage, mature analysis tooling | Concurrent VUs or VU-hours |
| NeoLoad | None (commercial) | Low-code design, enterprise governance, packaged-app support | VU-based licenses |
We recommend paying in three situations:
- Generator operations are eating sprints. If someone maintains runner fleets, region coverage, and result storage, a managed layer on the tool you already script in usually costs less than that person's time.
- The system under test isn't plain HTTP. SAP, Citrix, and similar packaged applications are where LoadRunner and NeoLoad earn their license.
- Audit and access control are requirements. Role-based access, SSO, and retained run history are standard in paid tiers.
A team of developers writing tests in code, with p95 and p99 thresholds gating CI, rarely needs the second or third reason. Price a managed k6 or Gatling tier against your generator costs before looking at a full enterprise suite.
How do you choose a performance testing tool?
Choose a performance testing tool by working down five filters in order: team skills, protocols, scale, CI fit, and budget. Stop at the first filter that leaves one or two candidates.
- Team skills. k6 scripts are JavaScript, Locust scripts are Python, Artillery uses YAML with JavaScript hooks, and Apache JMeter saves test plans as XML through a GUI. Pick the format your team will review in pull requests.
- Protocols. HTTP, WebSockets, and gRPC are covered by k6. JMeter adds JDBC, JMS, and FTP samplers for systems that are not HTTP-first.
- Scale and workload model. Check for native arrival-rate executors, since k6 has them and Locust is user-based. Then check how distributed load generation works: JMeter and Locust ship a controller-worker mode, while k6 needs an operator or cloud service.
- CI fit. The tool needs a CLI run with pass/fail thresholds on p95 and p99 latency. We recommend adding Lighthouse or sitespeed.io to the pipeline for front-end regressions.
- Budget. Weigh runner maintenance time against cloud pricing.
Avoid starting on The Grinder or Tsung, whose projects show little recent release activity.
FAQ: Performance testing tools
What tools are used for performance testing?
Is JMeter a performance testing tool?
What are the four main types of performance testing?
What are KPIs in performance testing?
What are typical performance tests?
Get help choosing a performance testing setup
Choosing between k6 and Lighthouse, or running both, depends on whether your bottleneck sits in the API layer or in the browser, and on how much of that your CI pipeline can enforce. Our engineers can review your stack, traffic profile, and release cadence, then recommend tools and a workload model that fit your team, including performance checks for AI projects.
Send your current setup through our project estimate form and we will suggest where to start.


