
Introduction
Contents
This guide is designed to enhance your understanding of the mechanics of predictive analytics, its benefits and limitations, and its practical applications. In the introductory section, we will explain what predictive analytics is and its historical development. In the next sections we will explore the basic terms as well as advantages and disadvantages of predictive analytics, supported by real-world examples.

Predictive analytics is a field of data science and a powerful technique that plays a vital role in today's data-driven world. It involves the use of historical and current data, statistical algorithms, and machine learning models to make accurate predictions about future outcomes or behaviors.
Data-driven forecasting holds immense importance as it enables businesses to gain valuable insights, anticipate trends, and make informed decisions. By analyzing patterns and relationships within data, predictive modeling empowers organizations to make proactive adjustments, optimize operations, and mitigate risks.
The applications of analytical forecasting span across various industries, for example:
- Finance: credit scoring, fraud detection, and investment analysis
- Marketing: customer segmentation, personalization campaigns, sales forecasting, recommendations engines
- Healthcare: disease prediction, patient risk stratification, and resource allocation
- Supply chain: demand forecasting, inventory optimization, supply planning and sourcing, and more.
Generative AI is applicable to various data types, including text, images, audio, and video. Text generation models, for instance, can produce realistic and coherent paragraphs, while image generation models can create unique visuals based on learned patterns from the training data.
The history of trend forecasting dates back several decades. Here is a brief overview of its progression:
- Early developments: The foundation can be traced back to the mid-20th century when statisticians and mathematicians began exploring mathematical models for forecasting. Techniques such as linear regression and time series analysis emerged during this period.
- Technological advancements: As computers became more prevalent and their computational capabilities improved during the 1970s and 1980s, the field began to gain traction. The increased availability of data storage and processing power enabled the creation of advanced models.
- Statistical modeling: In the 1990s, statistical modeling techniques like logistic regression, decision trees, and neural networks gained popularity. These models allowed for more accurate predictions by capturing complex relationships within data.
- Rise of machine learning: The early 2000s witnessed a shift towards machine learning algorithms. Algorithms such as support vector machines, random forests, and gradient boosting became prominent, enabling the handling of larger datasets and more complex tasks.
- Big data: The proliferation of big data in the 2010s brought new opportunities and challenges. The availability of vast amounts of data from various sources, along with advancements in processing power and storage, enabled the development of more accurate and scalable predictive models.
- Integration of AI: In recent years, the integration of artificial intelligence (AI) techniques, such as deep learning and natural language processing, has further expanded the capabilities. These advanced AI algorithms can handle unstructured data, extract meaningful insights, and make highly accurate predictions.
According to Statista’s report the analytical forecasting market revenue worldwide in 2020 and 2028, in 2020, the predictive analytics software market had a value of 5.29 billion U.S. dollars, and it is projected to reach 41.52 billion U.S. dollars by 2028. It is frequently employed to examine consumer behavior and effectively handle supply chains and business operations.
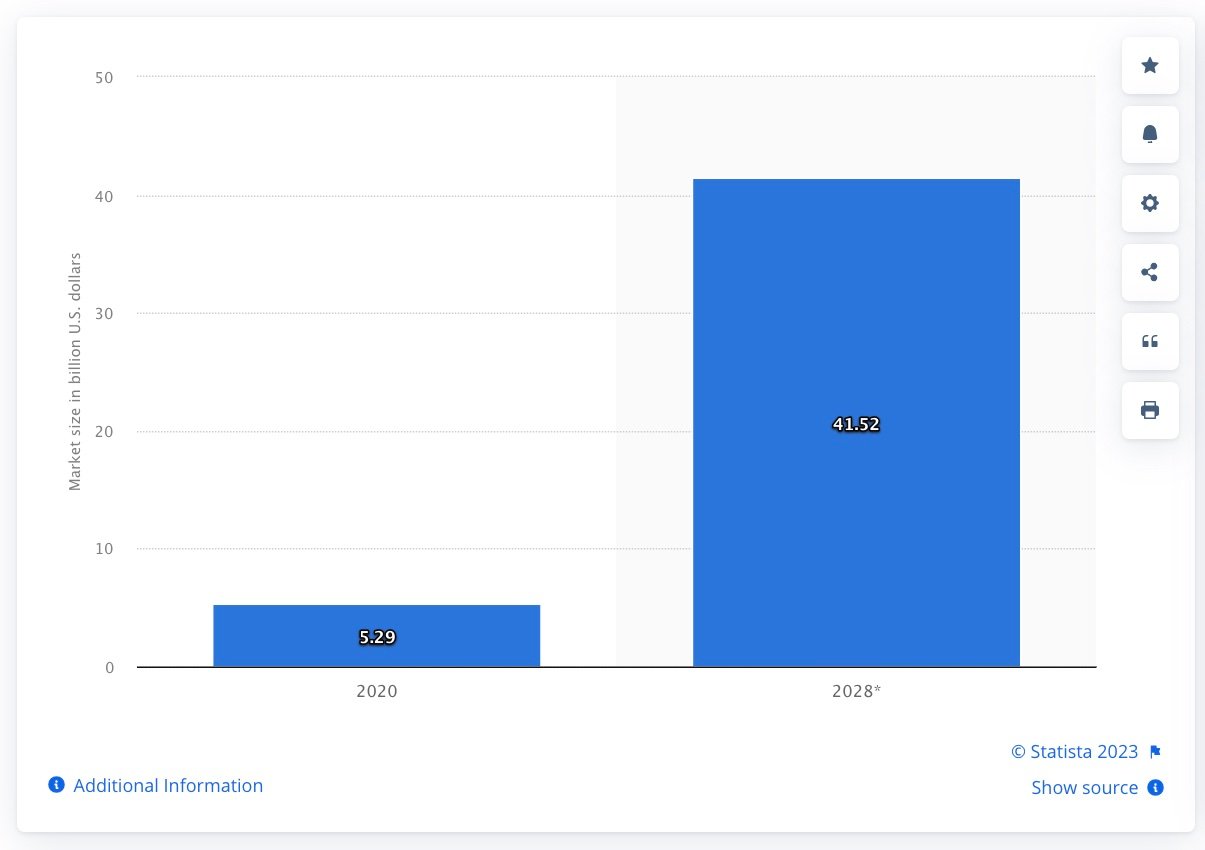
Image source: Statista
Here is a detailed and technical explanation:
- Data collection: The first step in predictive analytics is gathering relevant data. This data can come from various sources, such as databases, sensors, logs, or external datasets. The data should be comprehensive, representative, and include both historical and current information.
- Data preprocessing: Once the data is collected, it undergoes preprocessing. This involves cleaning the data to handle missing values, outliers, and inconsistencies. Data normalization or scaling may be applied to ensure that all features are on a similar scale. Additionally, categorical variables may be encoded to numerical representations for analysis.
- Feature engineering: Feature engineering involves transforming the raw data into meaningful features that can be used by predictive models. This process includes selecting relevant variables, creating new derived features, and performing dimensionality reduction techniques.
- Model selection: The next step is to select an appropriate predictive model. There are various models to choose from, including linear regression, decision trees, neural networks, support vector machines, and ensemble methods like random forests or gradient boosting. The choice of model depends on the nature of the problem, available data, and desired outcome.
- Model training: Once the model is selected, it is trained using the preprocessed data. During training, the model learns the underlying patterns and relationships between the input variables (features) and the target variable (the variable to be predicted). The model adjusts its internal parameters to minimize the prediction error using optimization algorithms such as gradient descent.
- Model evaluation: After training, the model's performance is evaluated using evaluation metrics suitable for the specific problem. Common metrics include accuracy, precision, recall, F1-score, and area under the curve (AUC). The evaluation is typically performed using a separate dataset called a validation set that the model has not seen during training.
- Model tuning: If the model's performance is not satisfactory, hyperparameter tuning is performed. Hyperparameters are adjustable settings that determine the model's behavior. Techniques like grid search, random search, or Bayesian optimization are used to find the best combination of hyperparameters that optimize the model's performance.
- Prediction and deployment: Once the model is trained and evaluated, it can be used to make predictions on new, unseen data. The model takes input data and applies the learned patterns to generate predictions or estimates of the target variable. The model can be deployed in a production environment where it continuously receives new data and generates predictions in real-time.
- Continuous monitoring and model updates: Predictive models should be monitored regularly to ensure they continue to perform accurately. As new data becomes available, the model can be updated or retrained periodically to incorporate the latest information and maintain its predictive capabilities.
Data-driven forecasting encompasses various techniques and models to forecast future outcomes. Here are some common types:
Regression analysis
Regression analysis is used to predict numerical values based on historical data. It identifies the relationship between dependent and independent variables and generates a regression equation that can be used for predictions.
Classification models
Classification models are used to categorize data into different classes or groups based on input variables. Examples include decision trees, logistic regression, and support vector machines. Classification models are commonly used for customer segmentation, fraud detection, and sentiment analysis.
Time series forecasting
Time series forecasting is used to predict future values based on historical data collected over regular time intervals. It considers trends, seasonality, and other patterns to generate forecasts. Time series models include autoregressive integrated moving average (ARIMA) and exponential smoothing methods.
Clustering analysis
Clustering analysis is used to group similar data points together based on their characteristics. It helps identify patterns and relationships within data without predefined classes or labels. Clustering is useful for market segmentation, anomaly detection, and customer profiling.
Anomaly detection
Anomaly detection identifies unusual or abnormal patterns in data. It is used to detect fraudulent activities, system failures, or unusual behavior that deviates from the norm. Anomaly detection techniques include statistical methods, clustering, and machine learning algorithms.
These are just a few examples of the types of predictive analytics techniques used in various domains. The choice of technique depends on the nature of the problem, the available data, and the desired outcome. Organizations often employ a combination of these techniques to gain a comprehensive understanding of their data and make accurate predictions.

Analytical forecasting involves several terms and notions that are commonly associated with its concepts and processes. Here are some key terms and notions:
Training data
Training data refers to the historical data used to build and train predictive models. It contains known outcomes or target variables that the model learns from to make predictions on new, unseen data.
Feature selection
Feature selection is the process of identifying the most relevant variables or features from the available data that have a significant impact on the predicted outcome. It helps in reducing noise and improving model performance.
Model evaluation
Model evaluation involves assessing the performance and accuracy of predictive models. Common evaluation metrics include accuracy, precision, recall, F1-score, area under the curve (AUC), and mean squared error (MSE).
Overfitting and underfitting
Overfitting occurs when a predictive model performs extremely well on the training data but fails to generalize well to new, unseen data. Underfitting, on the other hand, happens when a model is too simple and fails to capture the underlying patterns in the data. Balancing between overfitting and underfitting is crucial for optimal model performance.
Hyperparameter tuning
Hyperparameter tuning involves adjusting the settings or hyperparameters of a predictive model to optimize its performance. It includes techniques like grid search, random search, and Bayesian optimization to find the best combination of hyperparameters.
Cross-validation
Cross-validation is a technique used to assess the robustness and generalization capability of predictive models. It involves splitting the available data into multiple subsets, training the model on one subset, and evaluating its performance on the remaining subsets.
Ensemble methods
Ensemble methods combine multiple predictive models to make more accurate predictions. Techniques like random forests, gradient boosting, and stacking combine the predictions of individual models to improve overall performance and reduce biases.
Feature engineering
Feature engineering is the process of transforming or creating new features from the available data to enhance model performance. It involves techniques such as scaling, encoding categorical variables, creating interaction terms, and deriving new features from existing ones.
Deployment
Deployment refers to the process of implementing a trained predictive model into production or real-world applications. It involves integrating the model into a software system or workflow to generate predictions on new data.
Data visualization
Data visualization techniques are used to visually represent patterns, relationships, and insights within the data. Visualizations aid in understanding data distributions, trends, and the performance of predictive models.

Predictive modeling has numerous applications across various industries. Here are some common use cases for businesses:
Demand forecasting
Forecasting analysis plays a vital role in enhancing demand forecasting by utilizing historical data, statistical modeling, and incorporating external factors. Let's explore how it works in more detail:
The analysis begins by analyzing historical data related to sales, customer behavior, and other relevant variables. This data provides valuable insights into past demand patterns, seasonality, and trends. By understanding these patterns, predictive models can make informed predictions about future demand.
Statistical modeling techniques are then applied to the historical data. These models capture the relationships between different variables and demand, allowing analysts to identify significant factors that influence demand fluctuations. For example, regression analysis can help identify how pricing, promotions, or product attributes impact demand. Time series analysis is particularly useful for understanding demand patterns over time, including trends, seasonality, and cyclicality.
Predictive models also consider external factors that can influence demand. These factors can include economic indicators (e.g., GDP growth, unemployment rates), weather conditions (e.g., temperature, precipitation), or market trends. By incorporating these external factors into the models, predictive analytics can provide more accurate demand forecasts.
For example, if historical data shows a correlation between hot weather and increased ice cream sales, the model can adjust the forecast based on the predicted weather conditions for the future.
Machine learning algorithms are often employed within data-driven analysis for demand forecasting. These algorithms can automatically identify complex patterns and relationships in the data, leading to more accurate predictions. As more data becomes available, the models can be continually trained and refined, improving their forecasting capabilities over time.
The output of predictive decision-making in demand forecasting is a forecast of future demand, typically in the form of numerical values or probability distributions. This information helps organizations optimize their inventory management, production planning, and supply chain operations. By having a clearer understanding of future demand, businesses can minimize stockouts, reduce excess inventory, optimize resource allocation, and improve customer satisfaction.
Customer segmentation and personalization
Predictive analytics enables businesses to segment their customer base and personalize marketing and sales efforts. By analyzing customer data, behavior patterns, and demographics, businesses can identify customer segments with similar characteristics and preferences. This information can be used to tailor marketing campaigns, improve customer experiences, and increase customer satisfaction and loyalty.
Product recommendations
Crucially, the process of segmenting customers using predictive analysis relies on automated algorithms driven by data, and these algorithms can be continuously improved by training machine learning and artificial intelligence programs with additional data.
Organizing and presenting recommendations through product bundling is an effective approach. Recommendations are grouped together as a bundle of closely related products, resulting in a bundle that provides more value.
For instance, on Amazon, customers are often presented with accessory recommendations for high-performing products that are likely to be popular. In fact, there is a list of items associated with each product, frequently purchased together. These recommended products are often offered at discounted prices, enhancing the appeal of the recommendation.
Auchan, a multinational retail group based in France, utilizes geo-tracking within their app not only to suggest nearby store locations to customers but also to provide them with product recommendations while they are inside the store. For instance, when a customer scans the barcode of a product, the app immediately offers information about similar products with comparable prices available on the store shelves.

Churn prediction and customer retention
Retailers can utilize predictive analytics to pinpoint customers who are at risk of churn and develop strategies to retain them. For instance, it is frequently employed to identify customers who exhibit behaviors indicating a higher likelihood of canceling their subscription to a service.
The objective of the predictive model is to detect churn well in advance, such as one month, three months, or six months ahead.
Machine learning algorithms leverage historical customer churn data to identify customers with a high probability of churn. Subsequently, the customer retention department takes action to engage with these customers, which may involve offering incentives like gifts or promotions.
Fraud detection and risk management
Trend forecasting can be used to identify and prevent fraudulent activities. The analysis of historical transactional data, patterns, and anomalies allow businesses to develop models that detect fraudulent behavior in real-time. This helps minimize financial losses, protect customer data, and enhance security measures.
It plays a vital role in fraud detection and risk management by identifying patterns and anomalies in data that could indicate fraudulent activities or potential risks. Here's an explanation of how predictive analytics helps in this context, along with real-world examples:
- Pattern recognition
Predictive modeling algorithms analyze historical data and learn patterns of normal behavior in various transactions, customer interactions, or financial activities. These models can detect deviations from these patterns, which may indicate fraudulent behavior or potential risks.
The example can be credit card fraud detection. Banks and financial institutions use analytical forecasting to detect credit card fraud. The system analyzes transactional data, including transaction amounts, locations, and customer behavior patterns. Unusual transactions, such as high-value purchases in different countries, trigger alerts for further investigation, protecting customers from fraudulent activities.
- Anomaly detection
For example, insurance claim fraud detection. Insurance companies employ predictive analytics to identify fraudulent insurance claims. By analyzing various factors such as claim amount, claim history, and customer behavior patterns, the system can flag suspicious claims for investigation. Unusual patterns, such as frequent claims or claims with uncommon characteristics, help identify potential fraud and mitigate risks.
- Behavior analysis
It examines historical data to understand customer or user behavior and identify patterns associated with fraudulent actions. For example, online banking fraud prevention. The system monitors customer behavior, including login patterns, transaction history, and device information. If a customer suddenly exhibits unusual behavior, such as logging in from a new location or initiating large transfers, the system can trigger additional authentication measures or flag the activity for further investigation.
Predictive maintenance
Analytical forecasting is valuable for optimizing maintenance schedules and reducing equipment downtime. The analysts take into consideration sensor data, historical maintenance records, and machine learning algorithms, which allow them to predict when equipment or machinery is likely to fail. This enables proactive maintenance planning, reducing unplanned downtime and maximizing operational efficiency.
Financial and investment analysis
Predictive modeling can be applied in financial institutions for risk assessment, credit scoring, and investment analysis. By analyzing historical financial data, market trends, and economic indicators, businesses can make informed decisions about lending, investment opportunities, and portfolio management.
Supply chain optimization
Predictive analytics helps businesses optimize their supply chain operations. Through the examination of past data, demand trends, supplier performance, and external influences, companies have the ability to enhance inventory management, optimize transportation and logistics, and improve the overall efficiency of their supply chain operations.
Here are some examples of how data-driven analytics can enhance operational efficiency and supply chain management in the retail industry:
- Inventory management
Forecasting potential risks that may disrupt inventory levels. By analyzing fluctuating demand, conducting demand forecasting, examining historical data, and considering economic forecast trends, organizations can proactively manage their inventory. They can determine when to adjust stock levels, which items to remove, and accurately predict the number of units likely to be sold. This reduces stock wastage and enhances return on investment.
Shipping and transportation costs often constitute a significant portion of the final product price. Determining the optimal shipping frequency and quantity that meets high demand while minimizing expenses. Predictive route planning takes into account factors such as traffic congestion, distance, weather conditions, and drop-off points to identify the fastest routes. Additionally, intelligent monitoring of fuel consumption, tire pressure, driving style, and vehicle condition helps minimize overall transportation costs.Price optimization
Forecasting analysis enables businesses to swiftly respond to market dynamics, establish competitive pricing strategies, and ultimately maximize profits.
By leveraging data on competitor prices, coupled with predictions related to external factors like weather forecasts and real-time sales data, organizations gain valuable insights for setting the right prices for customers. This allows them to stay ahead of other retailers and accurately estimate future sales.
Starbucks exemplifies this approach by utilizing the analysis in their digital menu boards. This empowers Starbucks to make agile pricing decisions and effortlessly update and showcase prices in their stores, aligning pricing changes with optimal timing to reap the maximum benefits.
Pros
- Data-driven decision making: Enabling businesses to make data-driven decisions by providing insights and predictions based on historical data. This helps reduce subjective decision-making and enhances decision accuracy.
- Improved efficiency and performance: Optimizing various business processes, such as demand forecasting, inventory management, and supply chain optimization. This leads to improved efficiency, cost savings, and better overall performance.
- Enhanced customer experience: Analyzing customer data and behavior patterns in order to personalize the offerings, improve customer targeting, and enhance the customer experience. This can lead to increased customer satisfaction, loyalty, and retention.
- Risk mitigation: Identifying and mitigating risks, such as fraud detection, credit risk assessment, and predictive maintenance. This reduces financial losses, enhances security measures, and minimizes operational disruptions.
- Competitive advantage: Providing businesses with a competitive edge by enabling them to identify market trends, anticipate customer needs, and respond quickly to changing market conditions. This helps businesses stay ahead of competitors and seize new opportunities.

Cons
- Data quality and availability: If the data used for analysis is incomplete, inaccurate, or biased, it can lead to flawed predictions and inaccurate insights. Ensuring high-quality data and addressing data limitations can be a challenge.
- Interpretation challenges: Predictive models can be complex, and the interpretation of results may require expertise. Business users may need assistance from data scientists or analysts to understand and effectively utilize the predictions and insights generated by the models.
- Ethical considerations: Analytical forecasting involves handling sensitive customer data, raising ethical considerations regarding data privacy, security, and consent. Businesses must ensure compliance with regulations and adopt ethical practices to protect customer rights and maintain trust.
- Overreliance on historical data: Predictive analytics relies on historical data to make predictions about the future. However, if the business environment changes significantly or new factors emerge, historical data alone may not capture the full picture. It is important to continually update and adapt predictive models to reflect current conditions.
- Implementation challenges: Implementing forecasting analysis systems and integrating them into existing business processes can be complex and require significant investment in technology, resources, and training. Organizations must carefully plan and manage the implementation process to derive maximum benefits.
General tools
- Python: a wide range of analytics capabilities
- R: Widely used for statistical modeling and forecasting analytics.
- KNIME: Supports predictive modeling, data blending, and workflow automation.
- Google Analytics: Insights into website and marketing campaign performance, including predictive modeling for customer behavior analysis.
- Adobe Analytics: Trend forecasting features for marketing analytics, customer segmentation, and personalized marketing campaigns.
- Salesforce Marketing Cloud: Capabilities for lead scoring, customer segmentation, and campaign optimization.
- IBM Watson Analytics: Financial forecasting, fraud detection, and risk analysis.
- SAS Enterprise Miner: Advanced analytics and predictive modeling for financial institutions, including risk assessment and credit scoring.
- Bloomberg Terminal: Financial analytics and predictive modeling tools for investment analysis, market trends, and portfolio management.
Supply chain tools
- SAP Integrated Business Planning: Data-driven analytics for supply chain demand forecasting, inventory optimization, and logistics planning.
- Oracle Advanced Supply Chain Planning: Demand planning, supply network optimization, and inventory management.
- Llamasoft Supply Chain Guru: Predictive modeling and simulation capabilities for supply chain optimization and scenario analysis.
Healthcare tools
- Epic Systems: Predictive analytics for healthcare organizations, including patient risk assessment, disease prediction, and population health management.
- IBM Watson Health: Provides data-driven analytics for medical research, disease prediction, and personalized treatment plans.
- SAS Health Analytics: Predictive modeling and analytics for healthcare providers, payers, and researchers, including patient risk stratification and readmission prediction.
It's important to note that the choice of the best predictive analytics tool depends on specific business needs, data requirements, and available resources. Organizations may also opt for custom-built solutions or a combination of multiple tools to address their unique needs.
Predictive analytics uses historical and current data, statistical algorithms, and machine learning models to forecast future outcomes and optimize decision-making.
Data-driven forecasting is crucial for businesses as it allows them to extract valuable insights, predict trends, and make informed decisions. Predictive modeling, by analyzing data patterns and relationships, empowers organizations to proactively adjust strategies, optimize operations, and manage risks effectively.
Real-world use cases demonstrated how predictive analytics plays a crucial role in demand forecasting, customer segmentation, fraud detection, and supply chain optimization.
Paulina Pasławska
Product Manager at Netguru. Ph.D
New Media student in correlation with robotics and medicine. Experienced business analyst, speaker and multiple team manager with a demonstrated history of working in the fin tech, ecommerce and innovative marketing.
