How to Create Custom Charts in Compose Multiplatform


Contents
Compose Multiplatform is a modern toolkit that offers a wide range of useful and fascinating APIs.
In this technical walkthrough, I’ll try to explain the basic use of Canvas and how to draw simple custom charts.
As you study Canvas further, it will become evident that, as with almost everything in Compose, you can create a lot of elements with just a few lines of code. As you know, Compose Multiplatform is based on Google’s Jetpack Compose. It has a lot of overlapping functionality as Jetpack but Compose can be run on multiple platforms. The charts you’ll see below will work correctly on both Android and desktop apps.
Canvas
If graphic designers have Photoshop, developers have Canvas. You can go wild with your imagination as you create custom graphics and charts needed for your project.
Canvas is a composable function in the Jetpack Compose UI framework. You’re able to position the Canvas in your layout just like any other Compose UI element. It allows you to draw elements with precise control over their placement and styling. Compose Multiplatform Canvas functions in a similar manner but uses Skia Graphics Engine under its hood.
Coordinate system
When it comes to drawing on Canvas, you need to think in pixels rather than density-independent pixels. Keep in mind that Canvas drawing doesn’t scale automatically.
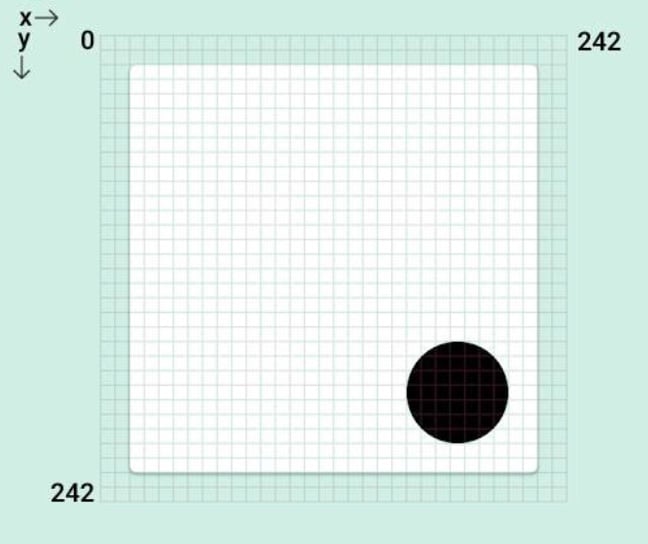
In the image above, you can see how the pixels are organized based on coordinates beginning with from (0,0) to (242,242). The X-axis runs from left to right, while the Y-axis runs from top to bottom. Each pixel represents coordinates, which serve as the foundation for arranging the UI elements on the screen. Use this information to place shapes or custom elements on the Canvas. Canvas allows you to position visual elements exactly where you want them.
Basic usage of canvas
There are two primary ways of using canvas.
- You can insert it just like any other composable:
@Composable
fun SimpleComposable1() {
    Box {
        Canvas(modifier = Modifier.size(200.dp)) {
            // your drawing code goes here
        }
    }
}
- You can use the
drawBehindmethod:
@Composable
fun SimpleComposable2() {
    Box(modifier = Modifier.size(200.dp).drawBehind {
        // your drawing code goes here
    })
}
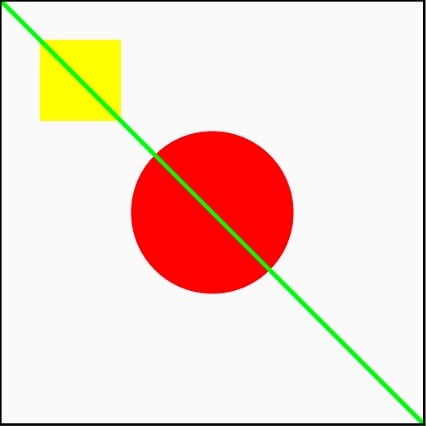
Drawing simple shapes Developers typically use Canvas in Android to create several forms of visual elements, the most common of which are different types of shapes. Consider the following:
// draw rectangle
 drawRect(
        color = Color.Yellow,
        topLeft = Offset(50f, 50f), // values in pixels
        size = Size(100f, 100f) // values in pixels
    )

// draw circle
 drawCircle(
        color = Color.Red,
        radius = 100f, // values in pixels
        center = center
    )

// draw line
drawLine(
        color = Color.Green,
        start = Offset(0f, 0f), // values in pixels
        end = Offset(size.width, size.height),
        strokeWidth = 5f // values in pixels
    )
- You can use extension functions to split the drawing code:
fun DrawScope.drawRectangleExample() {
    drawRect(
        color = Color.Yellow,
        topLeft = Offset(50f, 50f),
        size = Size(100f, 100f)
    )
}

fun DrawScope.drawCircleExample() {
    drawCircle(
        color = Color.Red,
        radius = 100f,
        center = center
    )
}

fun DrawScope.drawLineExample() {
    drawLine(
        color = Color.Green,
        start = Offset(0f, 0f),
        end = Offset(size.width, size.height),
        strokeWidth = 5f
    )
}
- Then, use it in your canvas:
@Composable
fun SimpleComposable1() {
    Box {
        Canvas(modifier = Modifier.size(200.dp)) {
            drawRectangleExample()
            drawCircleExample()
            drawLineExample()
        }
    }
}
How to draw simple charts
For those looking to build custom charts, you can start first with drawing basic ones as you begin your journey. In the following sections, I’ll do a brief walk through of drawing line charts, pie charts, and bar graphs.
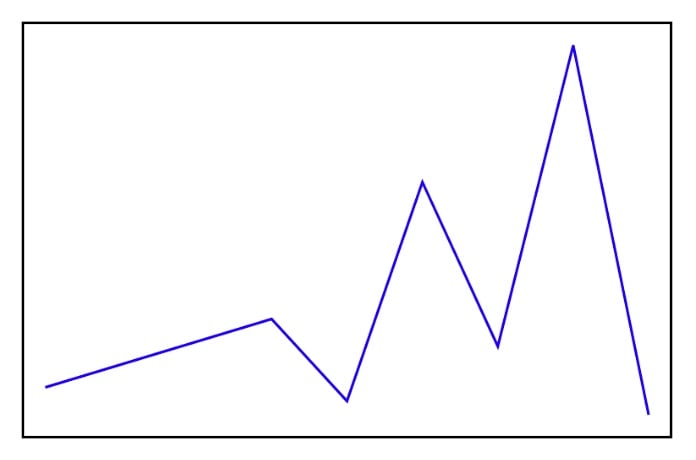
Line chart
Line charts are relatively simple to construct. The example below shows only the basics. It is stripped out from any optimizations to make it easier to read. In the real world, you should use remember to save states and avoid recalculation and redrawing.
//point representation
data class Point(val x: Float, val y: Float)

@Composable
fun SuperSimpleLineChart(modifier: Modifier = Modifier.size(300.dp, 200.dp)) {
    // our values to draw
    val values = listOf(
        Point(0f, 1f),
        Point(1.5f, 1.2f),
        Point(2f, 0.9f),
        Point(2.5f, 2f),
        Point(3f, 1.3f),
        Point(3.5f, 3.2f),
        Point(4f, 0.8f),
    )
    // find max and min value of X, we will need that later
    val minXValue = values.minOf { it.x }
    val maxXValue = values.maxOf { it.x }

    // find max and min value of Y, we will need that later
    val minYValue = values.minOf { it.y }
    val maxYValue = values.maxOf { it.y }

    // create Box with canvas
    Box(modifier = modifier
        .drawBehind { // we use drawBehind() method to create canvas

            // map data points to pixel values, in canvas we think in pixels
            val pixelPoints = values.map {
                // we use extension function to convert and scale initial values to pixels
                val x = it.x.mapValueToDifferentRange(
                    inMin = minXValue,
                    inMax = maxXValue,
                    outMin = 0f,
                    outMax = size.width
                )

                // same with y axis
                val y = it.y.mapValueToDifferentRange(
                    inMin = minYValue,
                    inMax = maxYValue,
                    outMin = size.height,
                    outMax = 0f
                )

                Point(x, y)
            }

            val path = Path() // prepare path to draw

            // in the loop below we fill our path
            pixelPoints.forEachIndexed { index, point ->
                if (index == 0) { // for the first point we just move drawing cursor to the position
                    path.moveTo(point.x, point.y)
                } else {
                    path.lineTo(point.x, point.y) // for rest of points we draw the line
                }
            }

            // and finally we draw the path
            drawPath(
                path,
                color = Color.Blue,
                style = Stroke(width = 3f)
            )
        })
}

// simple extension function that allows conversion between ranges
fun Float.mapValueToDifferentRange(
    inMin: Float,
    inMax: Float,
    outMin: Float,
    outMax: Float
) = (this - inMin) * (outMax - outMin) / (inMax - inMin) + outMin
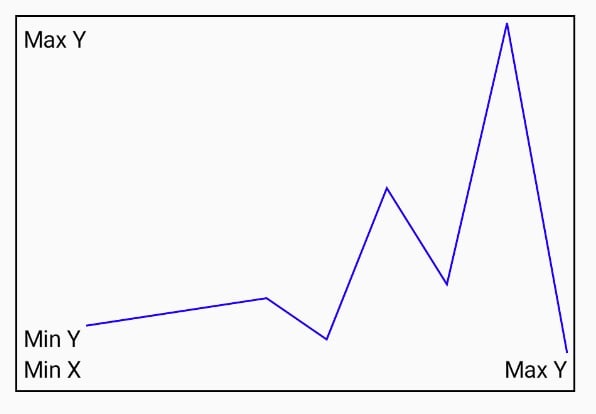
Because there is no straightforward method to put text onto the canvas in Compose Multiplatform (it can be done but it requires separate implementation for Android in oldschool view canvas and on Desktop in Skia engine), you can insert axis descriptions to the chart by wrapping other composable views around them.
To make the process simpler and the code more universal, you can wrap the graph in views.
@Composable
fun SuperSimpleLineChartWithLabels() {
    Column(
        Modifier
            .padding(10.dp)
            .border(width = 1.dp, color = Color.Black)
            .padding(5.dp)
            .width(IntrinsicSize.Min)
    ) {
        Row(Modifier.height(IntrinsicSize.Min)) {
            Column(
                modifier = Modifier
                    .fillMaxHeight(),
                verticalArrangement = Arrangement.SpaceBetween
            ) {
                Text(text = “Max Y”)
                Text(text = “Min Y”)
            }
            SuperSimpleLineChart()
        }
        Row(Modifier.fillMaxWidth(), horizontalArrangement = Arrangement.SpaceBetween) {
            Text(“Min X”)
            Text(“Max Y”)
        }
    }
}
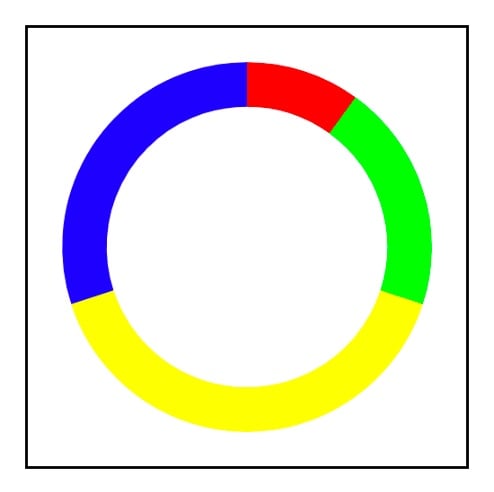
Pie chart
Pie charts are constructed from arcs. Use percentage as the input date. To draw an arc, you need start angle and sweep angle, which you can calculate from the percentage knowing that a circle has 360 degrees.
// pie chart data representation
data class PieChartItem(val percentage: Float, val color: Color)

@Preview
@Composable
fun SuperSimplePieChart() {

    // our values to be displayed in percentage.
    // As we assume that values are in percent, sum can’t be bigger than 100
    val values = listOf(
        PieChartItem(10f, Color.Red),
        PieChartItem(20f, Color.Green),
        PieChartItem(40f, Color.Yellow),
        PieChartItem(30f, Color.Blue)
    )

    // box with canvas
    Box(
        Modifier
            .size(200.dp) // we give the box some size
            .background(Color.White) // white background
            .padding(10.dp) // padding for nice look
            .border(width = 1.dp, color = Color.Black) // border for aesthetic
            .drawBehind { // create canvas inside box

                var startAngle: Float = START_ANGLE // we use the variable to track start angle of each arc

                values.forEach { // for each value
                    val sweepAngle = it.percentage.mapValueToDifferentRange( // we transform it to degrees from 0 to 360
                        inMin = 0f, // 0%
                        inMax = 100f, // 100%
                        outMin = 0f, // 0 degrees
                        outMax = FULL_CIRCLE_DEGREES // 360 degrees
                    )

                    // using extension function we draw the arc
                    drawArc(
                        color = it.color,
                        startAngle = startAngle,
                        sweepAngle = sweepAngle
                    )

                    startAngle += sweepAngle // increase sweep angle
                }
            })
}

// extension function that facilitates arc drawing
private fun DrawScope.drawArc(
    color: Color,
    startAngle: Float, // angle from which arc will be started
    sweepAngle: Float // angle that arc will cover
) {
    val padding = 48.dp.toPx() // some padding to avoid arc touching the border
    val sizeMin = min(size.width, size.height)
    drawArc(
        color = color,
        startAngle = startAngle,
        sweepAngle = sweepAngle,
        useCenter = false, // draw arc without infill
        size = Size(sizeMin - padding, sizeMin - padding), // size of the arc/circle in pixels
        style = Stroke( // width of the ark
            width = sizeMin / 10
        ),
        topLeft = Offset(padding / 2f, padding / 2f) // move the arc to center
    )
}
To spice up the chart, you can add simple but effective animation by adding a few extra lines and changing the sweepAngle limit from hard coded 360 degrees to an animated one, as such:
fun SuperSimplePieChart() {

    var animationPlayed by remember() { // to play animation only once
        mutableStateOf(false)
    }

    val maxAngle by animateFloatAsState( // animate from 0 to 360 degree for 1000ms
        targetValue = if (animationPlayed) FULL_CIRCLE_DEGREES else 0f,
        animationSpec = tween(durationMillis = 1000)
    )

    LaunchedEffect(key1 = true) { // fired on view creation, state change triggers the animation
        animationPlayed = true
    }

    .
    .
    .
     values.forEach { // for each value
                    val sweepAngle =
                        it.percentage.mapValueToDifferentRange( // we transform it to degrees from 0 to 360
                            inMin = 0f, // 0%
                            inMax = 100f, // 100%
                            outMin = 0f, // 0 degrees
                            outMax = maxAngle // <--- chagne this to maxAngle
                        )
    ...
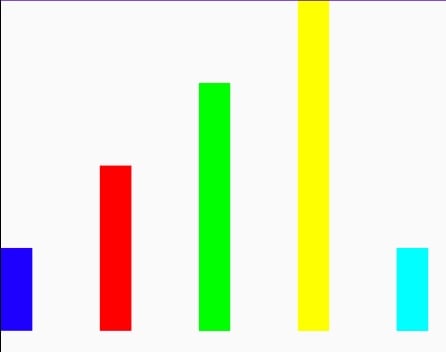
Bar graph
Drawing bar graphs is the simplest one. I think the code is self-explanatory:
data class Bar(val value: Float, val color: Color)

const val BAR_WIDTH = 50f //bar width in pixels

@Preview
@Composable
fun SuperSimpleBarChart(modifier: Modifier = Modifier.size(300.dp, 200.dp)) {
    // our values to draw
    val bars = listOf(
        Bar(10f, Color.Blue),
        Bar(20f, Color.Red),
        Bar(30f, Color.Green),
        Bar(40f, Color.Yellow),
        Bar(10f, Color.Cyan)
    )
    val maxValue = bars.maxOf { it.value } // find max value

    // create Box with canvas
    Box(
        modifier = modifier
            .drawBehind { // we use drawBehind() method to create canvas

                bars.forEachIndexed { index, bar ->
                    // calculate left and top coordinates in pixels
                    val left = index
                        .toFloat()
                        .mapValueToDifferentRange(
                            inMin = 0f,
                            inMax = bars.size.toFloat(),
                            outMin = 0f,
                            outMax = size.width
                        )
                    val top = bar.value
                        .mapValueToDifferentRange(
                            inMin = 0f,
                            inMax = maxValue,
                            outMin = size.height,
                            outMax = 0f
                        )

                    // draw the bars
                    drawRect(
                        color = bar.color,
                        topLeft = Offset(left, top),
                        size = Size(BAR_WIDTH, size.height - top)
                    )
                }
            })
}
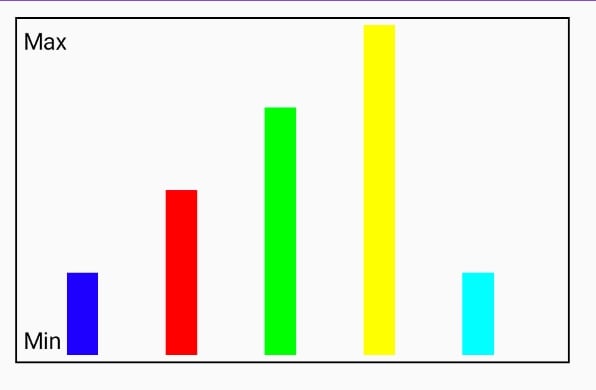
You can also add some extra touches:
@Composable
fun SuperSimpleBarGraphWithLabels() {
    Column(
        Modifier
            .padding(10.dp)
            .border(width = 1.dp, color = Color.Black)
            .padding(5.dp)
            .width(IntrinsicSize.Min)
    ) {
        Row(Modifier.height(IntrinsicSize.Min)) {
            Column(
                modifier = Modifier
                    .fillMaxHeight(),
                verticalArrangement = Arrangement.SpaceBetween
            ) {
                Text(text = “Max”)
                Text(text = “Min”)
            }
            SuperSimpleBarChart()
        }
    }
}
Conclusion
Canvas in Compose Multiplatform allows drawing any visual component. Still, it requires precise planning because we operate on actual pixels, and objects have to scale to window or screen size. It operates nicely on Desktop and Android, requiring very little platform dependent implementation. Unfortunately we can not use it on the Web or IOS, yet...


