
Ecommerce analytics: GA4 tracking setup, KPIs and tool choice

Contents
Ecommerce analytics comes down to three decisions: which metrics you define and how, how events get instrumented so the data can be trusted, and which stack fits your store's size, platform and team. Tools matter less than definitions and instrumentation.
A duplicate purchase event or an undefined AOV will undermine any dashboard built on top.
Ecommerce analytics in brief: What it covers and what to measure first
Ecommerce analytics measures how shoppers find, buy from and return to an online store, and it starts with GA4 ecommerce events that fire once per order with a correct value.
Track the purchase event first, with transaction_id, value, currency and items, then contribution margin, then customer lifetime value by cohort. Which of these metrics to prioritise also depends on your store's current stage of maturity, since early-stage shops and scaled retailers need very different measurement depth. Forecasting demand and customer value is a separate job, covered in our guide to predictive analytics in retail.
We recommend fixing event quality before buying a dashboard tool, because attribution models and forecasts inherit whatever the purchase event gets wrong. Netguru designs and builds ecommerce platforms, headless storefronts and data tooling, including tracking instrumentation and analytics integrations for growing online retailers.
On headless storefronts built on composable commerce solutions such as commercetools, tracking instrumentation has to be planned into the architecture from the start.
Which ecommerce KPIs should you track?
Track marketing efficiency ratio (MER) and CAC for acquisition. Measure conversion rate and AOV for conversion, cohort customer lifetime value for retention, and contribution margin for profit.
Each KPI needs a written formula, because GA4, the storefront and the finance ledger report different numbers under the same name. The table fixes the definition we recommend for each, plus the ambiguity to resolve before anyone builds a dashboard.
| Stage | KPI | Formula | Ambiguity to resolve |
|---|---|---|---|
| Acquisition | MER | Net revenue / total marketing spend, all channels | Net of refunds, discounts and tax? Does spend include agency fees and creative? |
| Acquisition | CAC | (Media + agency fees + creative + tooling) / new customers | New by first order on customer_id, not by email or session |
| Conversion | Purchase conversion rate | Sessions with a purchase event / sessions | Sessions or users? Deduplicate by transaction_id |
| Conversion | AOV | Net revenue / orders | Gross or net? Shipping charged included? Refund timing |
| Retention | Cohort CLV (12-month) | Cumulative contribution margin per customer, by first-order month | Revenue or margin? Observed or predicted? |
| Margin | Contribution margin | Net revenue - COGS - shipping - payment fees - returns cost - variable marketing | Which costs are variable, and when returns are booked |
AOV drives revenue and cash flow, so it is a strategic lever. Upselling, cross-selling and a free-shipping threshold raise it.
We recommend judging each lever by contribution margin per order. A bundle discount can raise AOV while lowering margin.
Define every formula once in the semantic layer, so the dashboard, the finance export and the ad platforms all read the same number.
How do you set up GA4 ecommerce tracking?
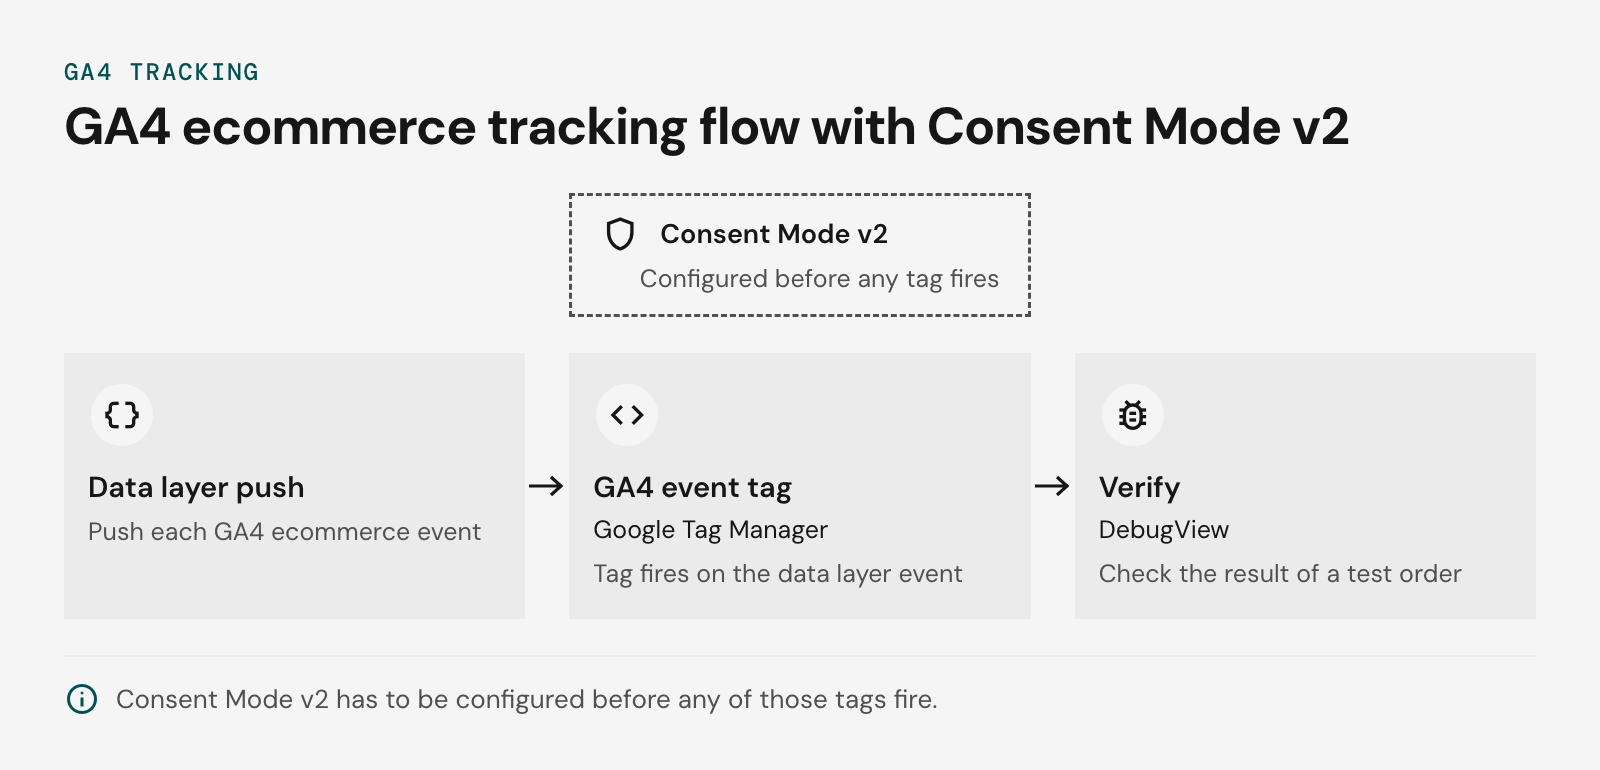
Set up GA4 ecommerce tracking by pushing each GA4 ecommerce event to the Google Tag Manager data layer, firing a GA4 event tag on it, and checking the result in DebugView. Consent Mode v2 has to be configured before any of those tags fire.
The purchase payload
The push below is an illustrative order of two units at 49.99 and one at 29.99:
window.dataLayer = window.dataLayer || [];
dataLayer.push({ ecommerce: null }); // clear the previous ecommerce object
dataLayer.push({
  event: "purchase",
  ecommerce: {
    transaction_id: "T-10482",
    value: 129.97,
    currency: "USD",
    tax: 10.40,
    shipping: 5.99,
    items: [
      { item_id: "SKU-123", item_name: "Trail shell", price: 49.99, quantity: 2 },
      { item_id: "SKU-456", item_name: "Wool cap", price: 29.99, quantity: 1 }
    ]
  }
});
Per Google's event reference, value is the sum of price times quantity across items, with tax and shipping in their own parameters. A missing currency stops revenue from being reported, and a string value breaks the sum.
Order of work
- Place the push. Fire it server-rendered on the order-confirmation page, after the order is persisted and above the GTM container snippet. Guard it so a page refresh does not push the same transaction_id twice.
- Build the GTM trigger and tag. Create a Custom Event trigger on purchase, then a GA4 Event tag named purchase with "Send Ecommerce data" set to the Data Layer source. Repeat for the other events in the table.
- Configure Consent Mode v2. Set defaults for ad_storage, analytics_storage, ad_user_data and ad_personalization before the container loads, then update them from your consent platform's callback. In advanced mode, denied states send cookieless pings that feed modeled data (basic mode sends nothing), so expect lower observed purchase counts for EEA traffic.
- Verify in DebugView. Start GTM Preview, open Admin, then DebugView, and complete a test order. Confirm purchase arrives once, with the full items array, currency and transaction_id.
Standard reports can lag by a day or more. Reconcile the first day of real orders against the storefront ledger, and check the GA4 BigQuery export for duplicate transaction_id values, because raw export rows show what the tag sent.
Link the GA4 property to Google Ads so the purchase event can be imported as a conversion for campaign measurement.
Enhanced ecommerce in GA4: What replaced it
GA4 replaced Universal Analytics' enhanced ecommerce with recommended ecommerce events, pushed to the Google Tag Manager data layer with an items array on each one.
| UA enhanced ecommerce action | GA4 event | Key parameters |
|---|---|---|
| Product impressions | view_item_list | item_list_id, item_list_name, items |
| Product click | select_item | item_list_id, items |
| Product detail view | view_item | currency, value, items |
| Add to / remove from cart | add_to_cart / remove_from_cart | currency, value, items |
| Checkout steps | begin_checkout, add_shipping_info, add_payment_info | currency, value, coupon, items |
| Purchase | purchase | transaction_id, value, currency, tax, shipping, items |
| Refund | refund | transaction_id, value, currency |
| Promotion impression / click | view_promotion / select_promotion | promotion_id, promotion_name, items |
The UA products array becomes items, id becomes item_id, name becomes item_name, and revenue becomes value. GA4 has no enhanced ecommerce toggle, and checkout funnels are no longer configured by step number. You build the funnel from event order in an Explore report or from the BigQuery export.
Before each push, run dataLayer.push({ ecommerce: null }) so a previous items array does not carry over into the next event.
What should a tracking audit check?
A tracking audit checks six failure points: duplicate purchase events, the definition of value, currency, release regressions, consent and ad-blocker loss, and whether server-side tagging earns its hosting cost. Reconcile GA4 against the order database first. Consent Mode v2, server-side tagging, and the Meta Conversions API each add their own ways to drift from it.
The checks, side by side:
| Failure mode | What to test | Early sign |
|---|---|---|
| Duplicate purchase on thank-you reload | Reload the confirmation page and reopen it from the order email. Confirm one purchase per transaction_id | GA4 transactions exceed orders |
| value omits shipping, tax, or refunds | Compare value to the order total. Decide whether it includes shipping and tax, and send refund events | Revenue gap versus finance stays a constant percentage |
| Currency mismatch | Confirm currency is an ISO 4217 code that matches value on every event | Multi-market revenue looks inflated or deflated |
| Consent and ad-blocker loss | Test with Consent Mode v2 signals denied, then with a blocker on | Paid-channel conversions drop after a consent banner change |
| Meta double-counting | Confirm the browser pixel and Conversions API send the same event_id and event_name | Meta reports more purchases than orders |
| Server-side tagging cost | Compare monthly container hosting with the purchases recovered | Hosting cost grows with traffic, recovered purchases don't |
Headless releases are the most common source of silent regressions. Assume a release renames the cart state key from item_id to sku. The data layer push still fires and purchase still arrives, so revenue totals look healthy.
But every item lands as (not set) in product reports and in the GA4 BigQuery export. Nobody notices until a merchandiser asks why best-sellers vanished.
We recommend a contract test in CI. A Playwright script walks the checkout flow, then validates each dataLayer push against a JSON schema for the event. A schema break then fails the build before the release ships.
How do you attribute revenue across channels?
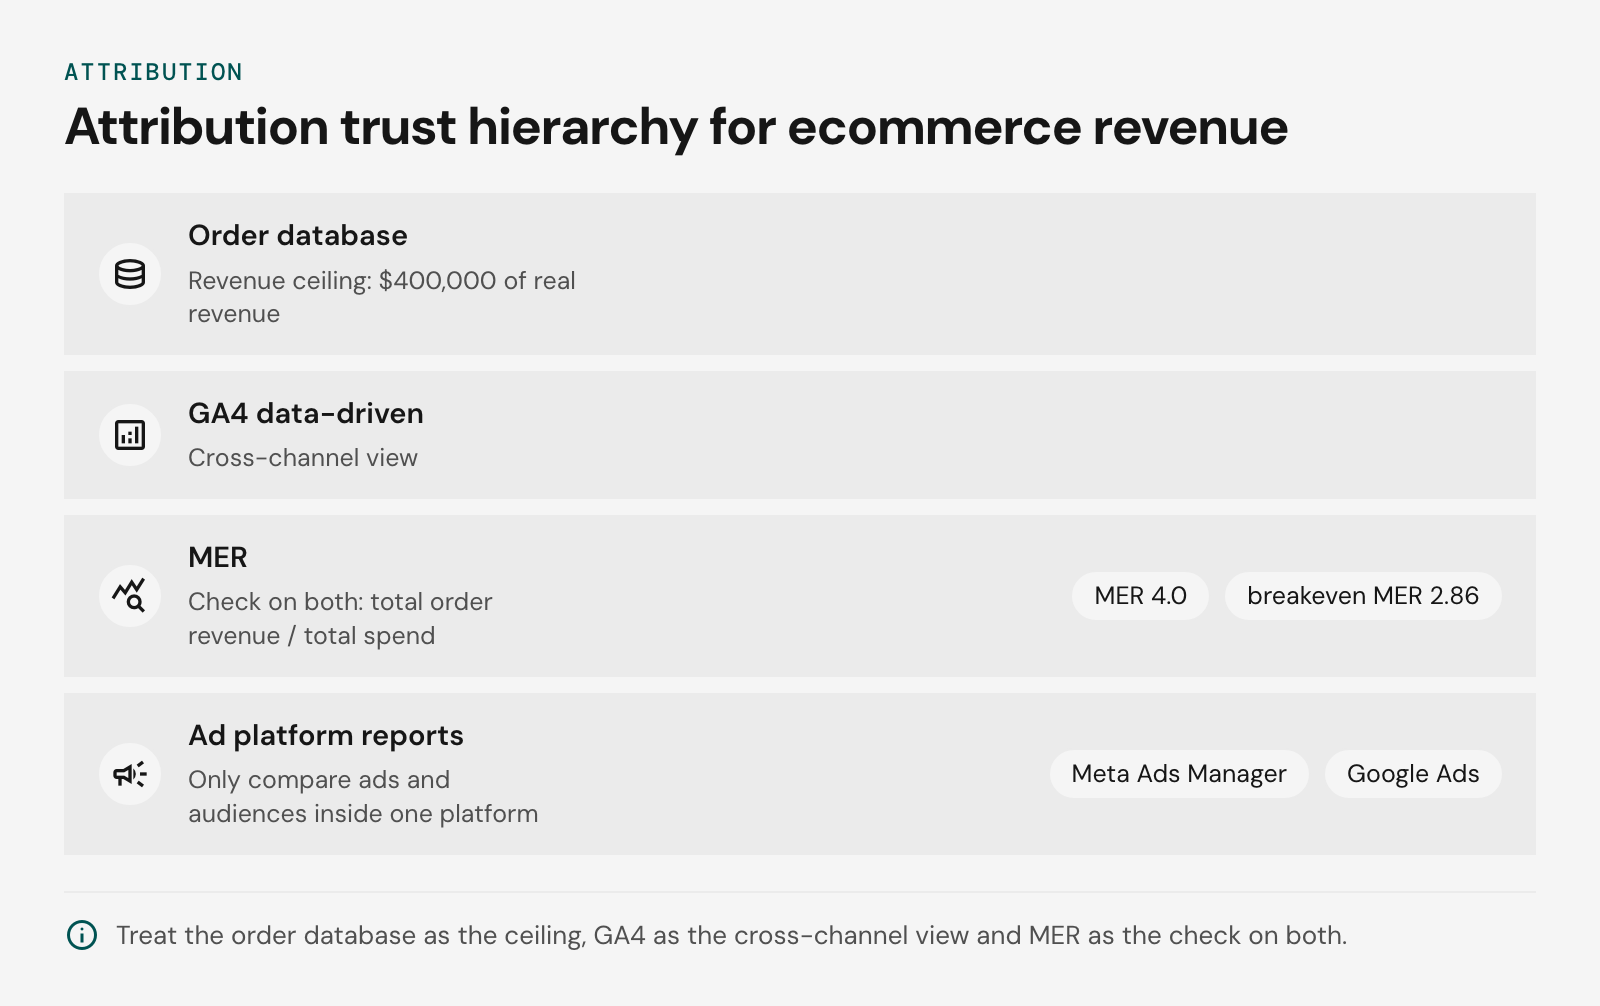
Attribute revenue across channels by treating the order database as the ceiling, GA4 data-driven attribution as the cross-channel view, and marketing efficiency ratio (MER) as the check on both.
Meta reports more revenue than GA4 for three reasons. Its window credits both click and view-through conversions. Each ad platform claims every order it touched without deduplicating against the others. Modeled conversions for consent-denied users add further volume.
Meta Ads Manager offers click-through attribution windows of 1-day click or 7-day click, engage-through of 1-day only, and view-through of 1-day view or none; 7-day and 28-day view windows were permanently removed in January 2026 (Bloom Analytics, 2026).
The worked example below uses assumed figures for one month, net of tax, shipping, and refunds:
| Source | Revenue | Spend | ROAS |
|---|---|---|---|
| Order database | $400,000 | n/a | n/a |
| Meta Ads Manager | $220,000 | $50,000 | 4.4 |
| GA4 data-driven attribution, Meta | $120,000 | $50,000 | 2.4 |
| Google Ads (platform-reported) | $180,000 | $50,000 | 3.6 |
Meta and Google alone claim $400,000, the store's entire real revenue, before email, affiliate and organic are counted. MER is $400,000 / $100,000 = 4.0, because it divides total order revenue by total spend.
Here is how we would diagnose the $100,000 gap between Meta ($220,000) and GA4 ($120,000). The split below is an assumption for illustration:
- $45,000 from view-through: customers saw an ad, never clicked, and later bought. Meta credits these; GA4 has no click to attribute.
- $30,000 from shared orders: buyers also touched Google Ads or email, and GA4 assigned those orders to other channels.
- $25,000 from duplicates: the browser pixel and Conversions API both fired, and missing event_id matching meant some purchases counted twice.
Only the duplicates are an error you can fix. The other two are differences in method, so they stay in the gap.
As an illustrative band, not a benchmark, we would accept Meta reporting up to 1.5x the GA4 figure for Meta. The starting ratio is 1.83x. Removing the $25,000 of duplicates brings Meta to $195,000, or 1.63x, which still sits above the band. At that point, compare a 1-day click view of Meta against GA4 before trusting the remaining difference.
Rely on MER for budget allocation across channels, especially when view-through is heavy or consent loss is high. Set the floor from margin: with an assumed 35% contribution margin before ad spend, breakeven MER is 1 / 0.35 = 2.86. Use platform ROAS only to compare ads and audiences inside one platform.
Why do your numbers disagree across tools?
Numbers disagree across ecommerce analytics tools because each one defines revenue, AOV, and customer acquisition cost differently, and GA4 adds thresholding and sampling on top. A written metric contract, enforced in a semantic layer, removes most of the gap.
Settle these definitions first:
- Revenue. GA4's purchase event carries value, with tax and shipping as separate parameters. Decide whether reported revenue includes them, name the metric accordingly (merchandise revenue or gross order revenue), and reconcile it to the order database.
- AOV, CAC and contribution margin. Use the formulas in the KPI table above. In practice, join refund events to orders on transaction_id so AOV is net of returns, and add agency and creative costs to platform spend for CAC, because platform dashboards report media spend only.
- Ownership. One named owner per metric, a change log, and the order database as the ceiling for any revenue figure.
GA4 reports can undercount for two reasons. Thresholding hides rows when Google signals or demographic data could identify users, and Explorations sample once a query exceeds the documented event quota for the property.
The GA4 BigQuery export contains unsampled, unthresholded event-level data. We recommend turning it on when you need order-level joins to returns and COGS, or when Explorations start returning sampled results. Standard properties have a daily export limit, so check it against your event volume.
A semantic layer such as LookML or the dbt Semantic Layer pays off once two or more teams or tools report the same metric. With a single analyst and one dashboard, a documented SQL view is enough, and the layer is overhead.
Which analytics tools fit which stage?
Ecommerce analytics tools fit by stage: GA4 with Triple Whale or Polar Analytics early on, and the GA4 BigQuery export with Looker once metric control matters more than setup speed. Teams that outgrow off-the-shelf dashboards often bring in a dedicated analytics partner to design the warehouse model and reporting layer.
The tools below are listed from least to most engineering effort. Pricing is shown as a tier because vendors change plans often; confirm current terms on each vendor's page.
| Tool | Best for | Integrations | Pricing tier | Engineering effort |
|---|---|---|---|---|
| GA4 | Baseline traffic and funnel reporting from GA4 ecommerce events | Google Ads and other Google products | Free (360 is paid) | Low, but needs a clean data layer |
| Looker Studio | Free dashboards over GA4, Sheets, or BigQuery | Native Google connectors, partner connectors | Free (Pro is paid) | Low |
| Crazy Egg | Heatmaps and behavior tracking on product and checkout pages | Common ecommerce platforms | Tiered by data history, active page views, and targeting | Low |
| Triple Whale | Shopify brands that want blended MER and ad-spend views in one place | Shopify, ad platforms, email tools | Subscription tiers | Low |
| Polar Analytics | Shopify brands that want a managed data model with custom metrics | Shopify, ad platforms, GA4 | Subscription tiers | Low to medium |
| Contentsquare | Session replay and journey analysis at higher traffic volumes | Tag-based, analytics and CDP connectors | Enterprise quote | Medium |
| GA4 BigQuery export + dbt | Raw event-level analysis, LTV and cohort retention, joins with order and cost data | BigQuery, any ELT source | Pay for storage and queries | Medium to high |
| Looker | Governed metrics through a semantic layer (LookML) | BigQuery and other warehouses | Enterprise quote | High |
| Adobe Analytics | Large multi-brand or multi-region estates already on Adobe | Adobe Experience Cloud, data feeds | Enterprise quote | High |
GA4's link to Google Ads makes it the default for measuring Google campaign effectiveness. Its limits show up outside Google's channels, where GA4 sees clicks but no impressions or cost unless you import them.
The build-vs-buy scorecard below uses illustrative stages, not benchmarks:
| Criterion | Ecommerce-native (Triple Whale, Polar) | Warehouse + BI (BigQuery, dbt, Looker) |
|---|---|---|
| Time to first trusted number | Days | Weeks to months |
| Metric control | Vendor definitions, some customization | Full, in your semantic layer |
| Contribution margin and CLV | Possible with cost data uploads | Native once COGS and returns are modeled |
| Ongoing staffing | Marketer-owned | Needs analytics engineering |
| Cost trajectory | Rises with plan tier | Rises with data volume and headcount |
We recommend buying through the early stage, when one marketer owns reporting and there is no analytics engineer. Start building once two or more sources of revenue truth disagree or contribution margin needs product-level cost data.
Hybrids work: keep the native tool for daily ad decisions and run finance reporting from the warehouse. Retailers weighing the buy-versus-build decision can compare options in our guide to retail business intelligence tools.
Affordable ecommerce analytics tools for small brands
Affordable ecommerce analytics for small brands starts with GA4 ecommerce events feeding Looker Studio, which costs nothing in licenses and covers most reporting until metric definitions or cost data break it.
Build view_item, add_to_cart, begin_checkout, and purchase through the Google Tag Manager data layer, with items, value, currency, and transaction_id on every purchase. Looker Studio's GA4 connector then gives you funnel and channel reports at no charge.
We recommend moving off this stack when one of three limits appears:
- Margin reporting: GA4 holds no COGS, shipping, or ad-spend data, and blending those sources in Looker Studio gets fragile.
- Metric drift: calculated fields live inside each report, so two dashboards can define MER differently.
- Data gaps: consent denials and ad blockers thin client-side events.
With engineers, enable the GA4 BigQuery export next. Without them, Triple Whale or Polar Analytics is the faster move. For behavior data on a small budget, Crazy Egg adds heatmaps.
How to track ecommerce data in Adobe Analytics
Adobe Analytics can read the same Google Tag Manager data layer you built for GA4, with each ecommerce event mapped to an Adobe success event and the items array rebuilt as a products string.
The mapping, using AppMeasurement variable names:
| GA4 element | Adobe Analytics equivalent |
|---|---|
| view_item | prodView event |
| add_to_cart | scAdd event |
| begin_checkout | scCheckout event |
| purchase | purchase event |
| transaction_id | s.purchaseID |
| currency | s.currencyCode |
items[] |
s.products |
Each item becomes one segment of the string, in the order category;product;quantity;price;events;eVars. An illustrative two-unit line looks like ;SKU-123;2;99.98;;eVar12=spring-sale, where eVar12 is a merchandising eVar.
Adobe computes revenue from the price field, which holds the line total (quantity times unit price), and ignores GA4's value. Reconcile shipping, tax, and discounts between the two tools before trusting either number. Passing transaction_id as s.purchaseID lets Adobe discard duplicate purchase hits from page reloads.
Ecommerce analytics dashboard for executives
An executive ecommerce analytics dashboard fits on one screen and leads with contribution margin, marketing efficiency ratio (MER), and customer lifetime value (CLV), served from a governed layer such as Looker. Revenue stays on the page as context. Teams still building their measurement foundations can start with our guide to web analytics fundamentals before adding margin and payback views.
We recommend nine tiles; past ten, a single screen stops being readable at a glance. The layout puts profit and payback in the top row, acquisition and retention in the middle, and operations and context at the bottom.
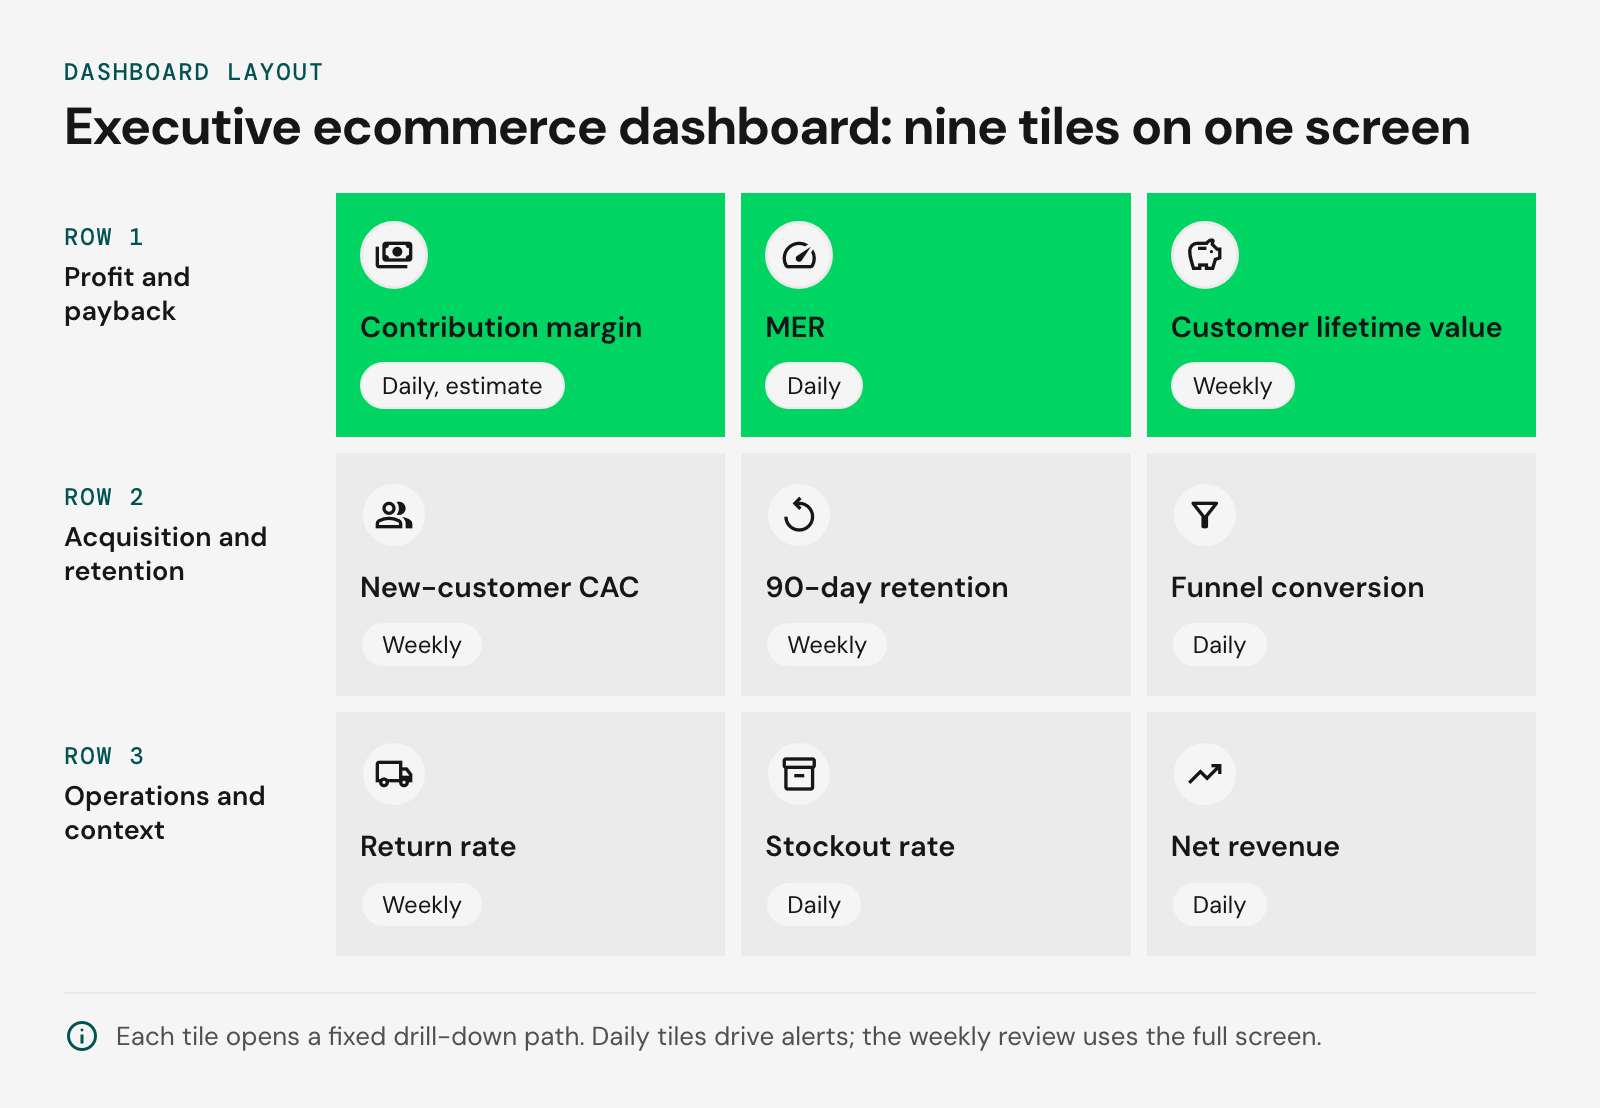
Each tile opens a fixed drill-down path, so a reader who spots a problem knows where the next click goes:
| KPI | Definition | Refresh | Drill-down path |
|---|---|---|---|
| Contribution margin | Net revenue minus COGS, shipping, payment fees, returns, and ad spend | Daily | Total → channel → SKU → cohort |
| MER | Total revenue / total marketing spend | Daily | Total → channel spend mix → campaign |
| New-customer CAC | Acquisition spend / first-time buyers | Weekly | Total → channel → campaign → audience |
| Customer lifetime value | Cumulative contribution margin per customer, by acquisition cohort | Weekly | Cohort month → first product → channel |
| Cohort retention | Repeat purchase rate at 90 days | Weekly | Cohort month → channel → first product |
| Funnel conversion | view_item to add_to_cart to begin_checkout to purchase | Daily | Funnel step → device → landing page |
| Return rate | Returned units / shipped units | Weekly | Category → SKU → reason code |
| Stockout rate | Share of top-revenue SKUs out of stock | Daily | Top SKUs → warehouse |
| Net revenue | Gross sales minus discounts and refunds | Daily | Region → category → SKU |
Contribution margin by channel, SKU, and cohort depends on joining the GA4 BigQuery export to cost data. Match purchase events on transaction_id and items.item_id against ERP cost and returns tables. Define MER and margin once in the semantic layer (LookML in Looker) so every view calculates them identically.
If finance closes COGS monthly, show daily margin as an estimate and restate it at close.
The marketing view breaks MER and CAC down by channel, with GA4's Google Ads integration supplying campaign-level cost and conversions. The ops view carries returns, stockouts, and fulfillment time. For page-level drill-downs below the funnel tile, add a behavior tool such as Crazy Egg for heatmaps and session recordings.
We suggest a weekly executive review on this screen, with the daily tiles reserved for alerting. Instrumenting the funnel end to end is what makes the conversion tile trustworthy.
Ecommerce analytics FAQ
What does an e-commerce analyst do?
Is ecommerce still profitable in 2026?
What are web analytics tools in digital marketing?
What are the top 5 web analytics tools?
What are the four main types of marketing analytics?
Get a tracking setup you can trust
A trustworthy tracking setup starts with an audit of your GA4 ecommerce events and your GA4 BigQuery export, checked against order data in your store backend.
Check that each purchase event carries transaction_id, value, currency, and a complete items array. Then reconcile daily BigQuery revenue against backend orders; gaps usually trace to consent loss, ad blockers, or duplicate firing.
Our Commerce Analytics & Insights services cover this kind of tracking audit and analytics stack review, and we can pair it with commerce development when the storefront needs changes. To have us review your setup, tell us about your project.


