
Design system audit: Process, checklist and template


Contents
A design system audit compares three things: what the system defines (tokens, components, patterns, documentation), what designers use in design files, and what ships in production code. The gaps between those three are the findings, and the audit ends in a prioritized backlog, not a list of complaints.
The method below covers inventory, drift measurement, WCAG 2.2 checks, tooling and a copyable checklist. How much of it you need depends on whether the system has an owner who can act on the results.
Design system audit: Defined vs designed vs shipped
Each finding falls into one of four groups: design-to-code drift, duplicates, accessibility gaps and stalled adoption.

Netguru builds design systems for clients and maintains its own, Silk. We recommend starting with a component inventory across all three sources, because an inventory taken from one source misses what the other two contain.
A UX audit reviews user journeys; this audit reviews the system behind them. If most components were rebuilt locally, a system rebuild is the better route.
Design system audit vs design system assessment
A design system audit produces evidence of gaps by comparing the system against Figma files and production code. A design system assessment judges maturity, governance and fit with the business. Run an audit when you need a defect list, and an assessment when you need a verdict on how the system is run.
The two differ in inputs and outputs:
| Design system audit | Design system assessment | |
|---|---|---|
| Question | Where do files and code differ from what the system defines? | Is the system mature, governed and suited to the products it serves? |
| Inputs | Component inventory in design files and code, token comparison, usage scanning, WCAG 2.2 checks | Interviews, contribution and release process, ownership, roadmap, adoption trends |
| Output | Prioritized backlog of drift, duplicates and accessibility gaps | Maturity rating, plus governance and staffing recommendations |
| Typical trigger | Rebrand, library migration, product merger | Stalled adoption, a funding decision, a change in team structure |
We recommend starting with the audit when teams disagree about what exists. A component inventory settles that with data, and an assessment run without one rests on opinion. Maturity scoring then draws on the adoption and coverage figures in design system metrics.
The order flips for a system under a year old with few consuming teams. There is little drift to find yet, so an assessment of ownership and release process gives more value.
When to run an audit, and when to rebuild instead
Run a design system audit when a specific event is about to change what the system must carry, and skip it when drift is too widespread to patch or nobody owns the fixes.
Four triggers justify the effort:
| Trigger | Audit scope | What it settles |
|---|---|---|
| Rebrand | Token-level | Which values are bound to semantic tokens and which are hardcoded in Figma and code |
| Product merger | Component inventory across both codebases | Duplicates, overlaps and which version survives |
| Stalled adoption | Adoption and usage | Whether teams detach instances or build custom because the components don't fit |
| Library migration | Component-level | Which components are used, and which to retire before moving |
A recurring audit also works. We suggest a lighter design-to-code drift check on a fixed cadence, with the full audit reserved for the triggers above.
Rebuild instead when a first-pass component inventory shows that fixing the backlog means rewriting components.
As an illustrative threshold, not a benchmark: if more than half of a sampled set of your ten most-used components differ between Figma and code in structure and API, a rebuild will cost less than reconciling them.
If that describes your system, a design system rebuild is the better starting point, and introducing it into an existing product is a separate planning problem.
Skip the audit as well when no one has capacity to act on it. Findings without a named owner and reserved sprint time become a report nobody reads, so settle ownership before collecting anything.
A rebuild still needs the inventory, because it defines which components the new system must replace.
How to run a design system audit step by step
Run a design system audit in six steps, moving from raw inventories in code and Figma to token and component comparison, then naming review and team interviews.
Each step ends in one artifact, and every later step reads from the component inventory built in step 1. If you are new to the building blocks being compared, this guide to design system components explains how they work in practice.
- Build the component inventory from both sides. Scan the codebase for imports of library components and for look-alikes that bypass them, list every Storybook story, and pull Figma library analytics for insertions and detachments per component. Tag each row as in-system, forked, or one-off. Artifact: one spreadsheet with a row per component per source.
- Compare design tokens across files and code. Export Figma variables and the repository's token file, ideally in the Design Tokens Community Group format. List values that exist on one side only, hardcoded values, and semantic tokens that skip their primitives. When UXPin audited its own product, it found 116 color variables to consolidate. Artifact: a token diff with unbound and duplicate values flagged.
- Compare components and measure design-to-code drift. Match each Figma component to its Storybook counterpart on variants, props, and states, and record the detached-instance rate from step 1. To check whether production matches the design, run visual regression testing against Storybook stories and, where practical, against rendered production pages. Artifact: a drift list with variant gaps and visual diffs per component.
- Test accessibility against WCAG 2.2. Run axe-core through Storybook's accessibility testing on every story, then check by hand what automation misses. Start with 1.4.3 Contrast (Minimum), 1.4.11 Non-text Contrast, 2.4.11 Focus Not Obscured (Minimum), and 2.5.8 Target Size (Minimum). Artifact: failures per component, each mapped to a success criterion.
- Review naming and documentation. Check that component and token names follow one convention and match between Figma and code, and that each component has usage guidance, props, and do/don't examples. Our design system documentation guide covers what good pages contain. Artifact: a list of name mismatches and undocumented components.
- Interview the consuming teams. Spend 30 minutes with one designer and one engineer from each team that ships with the system. Ask which components they avoid, which they forked, and what they built because the library lacked it. Artifact: a log of reasons, each linked to an inventory row.
The interviews explain the numbers. A high detachment rate on a component means little until a designer says the variant they needed did not exist. The scoring table that follows ranks these artifacts by severity, so keep every finding tied to its source row.
How long does a design system audit take?
A design system audit lasts as long as the component inventory takes to build and reconcile, and four drivers set that effort. Published durations vary too widely to be useful, so estimate from your own system instead.
The drivers and the point where each one stalls an audit:
| Driver | Why effort grows | Where audits stall |
|---|---|---|
| Component count | Every component needs a Figma-to-code comparison, and variant bloat multiplies the review per component | All variants get reviewed by hand, although Figma library analytics could rank components by usage first |
| Number of codebases | Each repository needs its own usage scan, and import patterns differ by framework | The second and third repositories are skipped, so drift findings describe one product |
| Theming modes | Each mode (light, dark, brand) repeats token and contrast checks, including WCAG 2.2 criteria 1.4.3 and 1.4.11 | Only the default mode is checked |
| Part-time system team | The audit competes with roadmap work, so calendar time stretches even when effort does not | Findings sit unscored while the inventory goes stale |
We recommend fixing the schedule only after the inventory exists, because component count is the one input you can measure on day one. Audit the most-used components first and queue the long tail. Where your Figma plan does not expose library analytics, rank by codebase imports.
How to audit a design system in Figma
Audit a design system in Figma by checking Figma variables against the token source, instances against their main components, and Figma library analytics for adoption by team.
Start with library analytics to find which files and teams use the library. Then scan those files for detached instances and for attached instances that carry overrides. Compare Figma variables with the token file, exported in the Design Tokens Community Group format, by alias chain and mode, since resolved values hide most theming faults.
The methods side by side, with what each one gets wrong:
| Method | What it flags | False positives | Blind spot |
|---|---|---|---|
| Library analytics | Insertions and detachments per component and team | Deliberate detaches for one-off layouts; abandoned files | Overrides on attached instances; unpublished local copies |
| Detached-instance scan (plugin or Plugin API script) | Frames that match a component's structure but have no link | Look-alike frames built before the component existed | Components rebuilt with a different structure |
| Variable-to-token diff | Missing, renamed or mismatched variables | Design-only variables; modes that exist only in Figma | Alias differences that resolve to the same value |
A value-level diff can pass while theming is broken. For example, a surface variable resolves to the same hex in Figma and in code in light mode.
Figma aliases it to a gray 100 primitive, while the code aliases the dark mode to a different step. The match holds in one mode and the dark theme ships with the wrong surface.
Variables bound directly to primitives skip semantic token aliasing and survive until the first rebrand.
Detached instances are the visible problem, and overridden attached instances are the hidden one. Analytics counts an attached instance with a swapped fill, a local text style or hidden layers as healthy usage. Check overrides against the properties the component exposes. Text content and exposed variants are legitimate, while fill, spacing and corner radius overrides are drift.
How to check whether production matches the design
To check whether production matches the design, measure design-to-code drift in three layers (tokens, components and rendered output) and reconcile the results in a single parity matrix. Each layer has its own source of truth and its own mismatch signal.
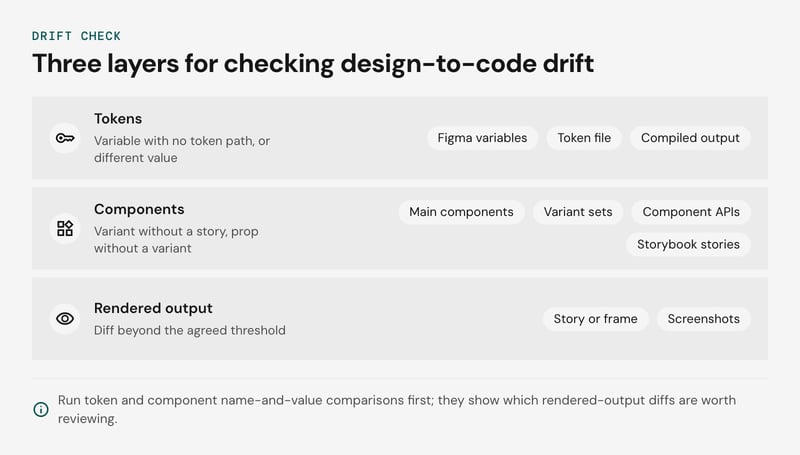
The parity matrix, side by side:
| Layer | Design side | Code side | Drift signal |
|---|---|---|---|
| Tokens | Figma variables | Token file in the Design Tokens Community Group format and the compiled output | Variable with no matching token path, same path with a different resolved value |
| Hard-coded values | Unbound fills and strokes in files | Literal colors, spacing and font sizes in stylesheets and component code | Literal that equals a token value, or matches none |
| Components | Main components and variant sets | Exported component APIs and Storybook stories | Variant without a story, prop without a variant, name mismatch |
| Usage | Figma library analytics by team | Component usage scanning of imports across repositories | High design usage with low import count, or the reverse |
| Rendered output | Story or frame baseline | Screenshots from visual regression testing | Diff beyond the agreed threshold |
Run the token and component rows as name-and-value comparisons first. They are cheap, and they tell you which rendered-output diffs are worth reviewing.
Where each check produces false positives
Three sources of noise inflate drift numbers if you take the raw output at face value.
- Wrapper components. Product teams often re-export a system component under a local name to pre-set props. A scanner that matches on package imports counts these as custom components. Resolve re-exports back to the system package, or keep an allowlist of known wrappers.
- Stories that production never renders. Storybook stories cover states such as disabled, loading and long-text overflow. A story without a production counterpart is coverage of the component, not drift. Use stories as the reference for what a component can do, and use the scan for what products render.
- Visual regression noise. Font rendering, anti-aliasing, animations and live data produce diffs that mean nothing. Baseline against isolated stories, freeze animations, and mask dynamic regions. Full-page baselines on production data will flag nearly every release.
Hard-coded values need the same filtering. Third-party embeds and one-off campaign pages legitimately carry literals, so scope the scan to product code.
Turning the matrix into a repeatable measure
We suggest tracking two ratios per release. Token coverage is the share of color, spacing and type declarations that resolve to a token. System usage is the share of rendered UI components that trace back to the system package after wrappers are resolved.
Both are our own working definitions, so state the scope with every number. Design system metrics covers how to trend them over time.
How to audit accessibility against WCAG 2.2
Audit accessibility against WCAG 2.2 by testing every component in every state it ships, and record each result in a per-component, per-state matrix.
Rows are components. Columns are default, hover, focus, disabled and error, and each cell holds pass, fail or not applicable, plus the failing criterion. The default story usually passes, so the failures sit in the other columns.
The checks per state:
| State | What to check | Criteria |
|---|---|---|
| Default | Accessible name and role, text contrast, target size | 4.1.2, 1.4.3, 2.5.8 |
| Hover | Tooltips and popovers stay visible until dismissed, and the pointer can move onto them | 1.4.13 |
| Focus | Indicator is visible, has enough contrast, and is not hidden | 2.4.7, 1.4.11, 2.4.11 |
| Disabled | State is exposed programmatically, and nothing relies on the control alone | 4.1.2 |
| Error | Message is tied to the field, not color-only, and announced | 3.3.1, 1.4.1, 4.1.3 |
Two of the criteria added in WCAG 2.2 matter most for component libraries, and both are Level AA. Target Size (Minimum), success criterion 2.5.8, asks for pointer targets of at least 24 by 24 CSS pixels, with exceptions for spacing and inline text.
Test the densest variant of each component, since compact table rows and icon buttons are where it fails.
Focus Not Obscured (Minimum), success criterion 2.4.11, fails when author-created content such as a sticky header, cookie banner or chat widget fully covers the focused element. A Storybook story renders the component in isolation, so check this in a page that includes those overlays.
Automated checks cover the mechanical part. The Storybook accessibility addon runs axe-core against each story, and running it per state story gives you the matrix's first pass. It flags missing names, contrast failures and invalid roles.
It cannot judge whether an accessible name makes sense, whether focus order follows the visual order, or whether an overlay hides the focus ring. Treat a clean axe-core run as the entry condition for manual review, not as a pass.
Screen reader testing is needed for custom widgets such as comboboxes, dialogs, tabs and menus, and for every error pattern. Check that the role, name and state are announced, and that validation messages reach the user without a focus move. Run each pattern once with NVDA and once with VoiceOver, and log the result in the matrix.
For mistakes that recur in shipped interfaces, see common web design accessibility mistakes.
Which tools help automate a design system audit
Automating a design system audit takes Figma library analytics, component usage scanning, Storybook with axe-core, and visual regression testing, because each covers only part of the design-to-code gap.
The table shows what each one sees and where it is blind.
| Tool type | What it sees | Blind spot |
|---|---|---|
| Figma library analytics | Component, style and variable usage by team, including detachments | Nothing about code, so a component that is inserted correctly but overridden in the front end looks healthy |
| Design file plugins | Unbound fills, hardcoded values and detached instances inside files | Code overrides and anything that only exists in production |
| Component usage scanning | Imports of system components, local forks and hardcoded values across repositories | Detached instances and design-only drift, since the scanner never opens a design file |
| Storybook with axe-core | Each story in each state, checked against the automatable subset of WCAG 2.2 | Stories nobody wrote, production pages, and criteria that need human judgment |
| Visual regression testing | Pixel changes against an approved baseline | A baseline that was already wrong |
Design-to-code drift sits between the first two rows and the last three. To close that gap, export design tokens from Figma variables and from the code repository in the Design Tokens Community Group format, then diff the two exports. Unmatched names and values are your drift list.
The first audit pays for the tooling. Once it exists, we recommend turning the findings into standing checks:
- A lint rule that rejects hardcoded values where a token exists.
- An axe-core run on every story in CI.
- Visual regression snapshots on every pull request that touches a component.
A later re-audit then reviews exceptions and the component inventory, and the consuming-team interviews remain manual. This works best when stories cover most shipped components. With thin Storybook coverage, expect to scan production pages directly.
How to score findings and build the backlog
Score each design system audit finding by severity, using the finding type, the signal that exposed it, how often the affected component or token is used, and the typical fix, then sort the backlog by that score.
Our scoring rule: severity is impact multiplied by usage. A hard-coded color in a rarely used banner ranks below the same fault in a button that ships in every flow. An accessibility failure that blocks a task ranks first whatever the usage.
The scoring guide for the most common findings:
| Finding type | Signal | Severity | Typical fix |
|---|---|---|---|
| Hard-coded values | Component usage scanning finds raw hex or pixel values outside token files | High on shared components, low on one-off screens | Map to a semantic token and add a lint rule |
| Detached instances | Figma library analytics show detach counts per component | Medium, high when the same component is detached repeatedly | Add the missing variant or retire the component |
| Design-to-code drift | Mismatch between Figma variables and the token export, or visual regression diffs in Storybook | High on tokens shared across products | Name one source of truth and sync it in CI |
| Variant bloat and duplicates | Inventory shows near-identical components | Low to medium | Merge and deprecate |
| Accessibility failure | axe-core in Storybook plus manual WCAG 2.2 checks | High when it blocks a task | Fix in the component and release a patch |
Repeated detaches usually mean the library lacks a variant teams need. Treat them as a product gap, not as designer error.
The audit report has four parts:
- A findings register with evidence and the source tool for each item.
- A scored backlog with an owner and a fix per item.
- Baseline measurements.
- A short list of governance changes.
Record the baseline when the audit closes: the share of UI built from library components, the share of style declarations that resolve to tokens, detach counts per component, and the number of mismatched tokens. Re-run the same scans on the same scope at the next audit, so the change is comparable.
Feed the scored backlog into the design system roadmap, with high-severity items in the next release.
Design system audit checklist
A design system audit checklist covers seven areas: tokens, components, patterns, accessibility, documentation, governance and adoption. Copy the list below into your own design system audit template, or start from our design system template, and mark each item pass, fail or not measured.
- Tokens: Export tokens from Figma and from code into the Design Tokens Community Group format and diff the two sets. Flag primitives referenced directly by components, near-duplicate values and hard-coded values in code.
- Components: Build a component inventory covering Figma and code, with name, variants, status and owner for each entry. Mark duplicates, variant bloat and components that exist on only one side.
- Patterns: Check that forms, empty states, navigation and error handling reuse documented patterns across at least two products.
- Accessibility: Run axe-core against every Storybook story, then test by hand against WCAG 2.2 success criteria 1.4.3 (contrast), 1.4.11 (non-text contrast), 2.4.11 (focus not obscured) and 2.5.8 (target size). Automated checks cover only part of the criteria, so add keyboard and screen reader passes.
- Documentation: Confirm each component has usage guidance, API notes, accessibility notes and a Storybook story that matches its Figma counterpart. The design system documentation guide covers what good looks like.
- Governance: Confirm every component has an owner, a contribution path, a versioning rule and a deprecation policy. See the design system governance guide for the decision rights behind these.
- Adoption: Pull Figma library analytics for insertions and detached instances. Run component usage scanning in the codebase to compare imports with local forks. Add visual regression testing on shipped pages to catch design-to-code drift.
Record the date and raw counts for each item so the next audit has a baseline. Teams with one product and a handful of contributors can usually merge the governance and documentation groups into one.
Design system audit FAQ
How do you measure design-to-code drift?
How often should you audit a design system?
Start with the inventory
Every later step of a design system audit reads from the component inventory, so build it first, across the system, design files and code, and settle who owns the fixes before you collect anything else. With those two in place, the drift checks, accessibility matrix and scored backlog have something to stand on, and the findings have someone to act on them.
If you would like a second pair of eyes on your inventory or a plan for the fixes, tell us about your design system and our designers and front-end engineers will review it with you.


